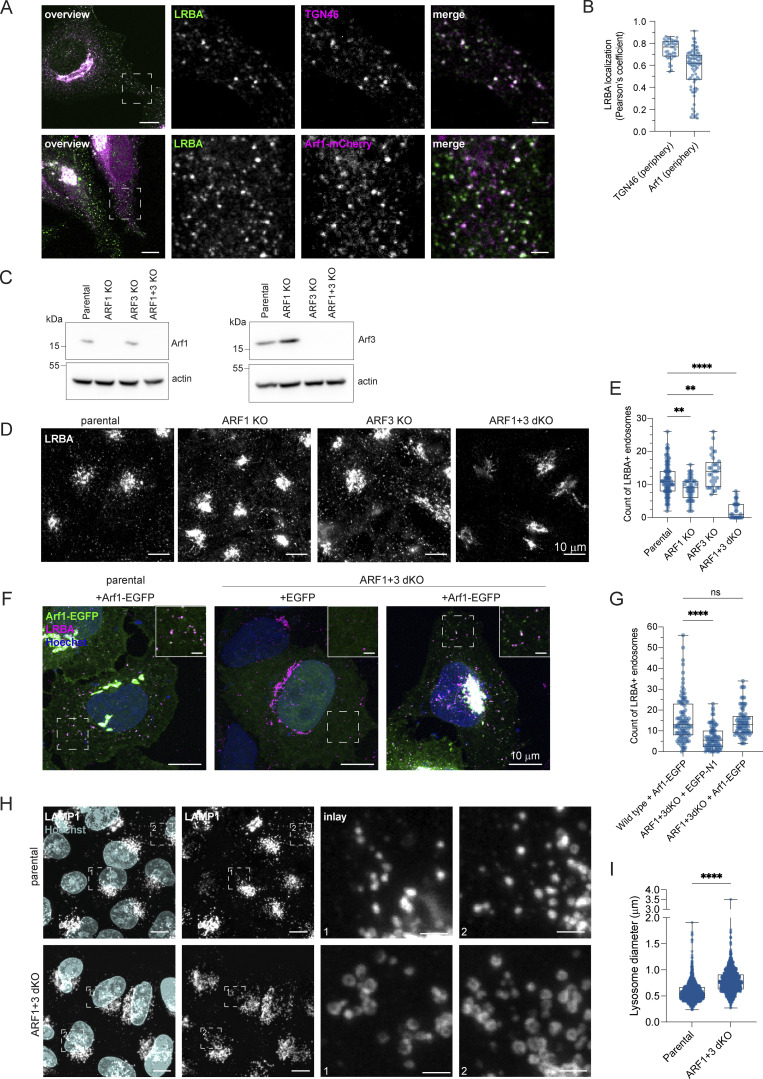
Figure 7.
LRBA is recruited onto endosomes by Arf1 and Arf3. (A) Colocalization analysis of LRBA and TGN46 or Arf1 on endosomes in HeLa cells. For the colocalization analysis with the TGN, HeLa cells were fixed with 4% PFA and stained for endogenous TGN46 and LRBA. For colocalization analysis with Arf1, HeLa cells were transfected with ARF1-mCherry, fixed with 4% PFA and stained for endogenous LRBA. Squares show magnification of the perinuclear area. The labeling of the single channels represents the color of the channel on the merged image. Scale bar, 10 μm, inlays 2 μm. (B) Colocalization measurements of LRBA with TGN46 and Arf1 at the cell periphery. To measure LRBA colocalization with TGN46 one ROI per image, with Arf1 two ROIs per image were analyzed and the Pearson’s coefficient was measured using the JACoP plugin in Fiji. Mean and minimum to maximum are shown, the box ranges from the first (Q1–25th percentiles) to the third quartile (Q3–75th percentiles) of the distribution. All data points are shown. TGN46 (periphery) = 40 cells, Arf1 (periphery) = 35 cells from n = 3 biological replicates. (C) Immunoblot analysis of Arf1 and Arf3 expression in parental, ARF1 KO, ARF3 KO, and ARF1+3 dKO HeLa cells. Actin was used as a loading control. (D) LRBA is absent from endosomes in ARF1 and ARF3 dKO HeLa cells. Note that LRBA is still present on the Golgi. Parental, ARF1 KO, ARF3 KO, and ARF1+3 dKO HeLa cells were seeded on coverslips, fixed, and stained for endogenous LRBA. Maximum intensity projections of confocal images are shown. (E) The number of LRBA+ endosomes in parental, ARF1 KO, ARF3 KO, and ARF1+3 dKO cells was measured using two ROIs per cell. Mean and minimum to maximum are shown, box ranges from the first (Q1–25th percentiles) to the third quartile (Q3–75th percentiles) of the distribution. All data points are shown. Parental = 95 cells, ARF1 KO = 49 cells, ARF3 KO = 32 cells, and Arf1+3 dKO = 34 cells were analyzed from n = 3 biological replicates; one-way ANOVA using Dunnett’s multiple comparison, **P = 0.0010 (parental versus ARF1 KO), **P = 0.0097 (parental versus ARF3 KO), ****P < 0.0001. (F) Arf1-EGFP re-expression rescues LRBA+ endosomes absent in ARF1+3 dKO cells. Parental HeLa cells were transfected with Arf1-EGFP, and ARF1+3 dKO cells were transfected either with EGFP as a control or with Arf1-EGFP. Cells were then fixed and stained for endogenous LRBA and with Hoechst. Maximum intensity projection of confocal Z-stacks is shown. Rectangles show the magnified area in the upper right corner. Scale bar on inlays 2 µm. (G) The number of LRBA+ puncta are counted based on data in F. Two ROIs at the cell periphery per cell are analyzed. Mean and minimum to maximum are shown, box ranges from the first (Q1–25th percentiles) to the third quartile (Q3–75th percentiles) of the distribution. All data points are shown. Parental = 49 cells, EGFP rescue = 42 cells, Arf1-EGFP rescue = 39 cells were analyzed from n = 3 biological replicates; Kruskal–Wallis test using Dunn’s multiple comparison, ****P < 0.0001. (H) (Endo)lysosomal structures are enlarged in ARF1+3 dKO cells. Parental and ARF1+3 dKO HeLa cells were seeded on coverslips, fixed, and stained for LAMP1 and with Hoechst. Maximum intensity projections of confocal Z-stacks. Squares show magnification of the (endo)lysosomes. Scale bar, 10 μm, inlays 2 μm. (I) Quantification of lysosome diameter based on images shown in H. The diameter of round lysosomes was measured manually in Fiji. Mean and minimum to maximum are shown, box ranges from the first (Q1–25th percentiles) to the third quartile (Q3–75th percentiles) of the distribution. Parental = 60 cells, ARF1+3 dKO = 64 cells were analyzed from n = 3 biological replicates. All data points are shown. Mann–Whitney test, ****P < 0.0001. Source data are available for this figure: SourceData F7.

