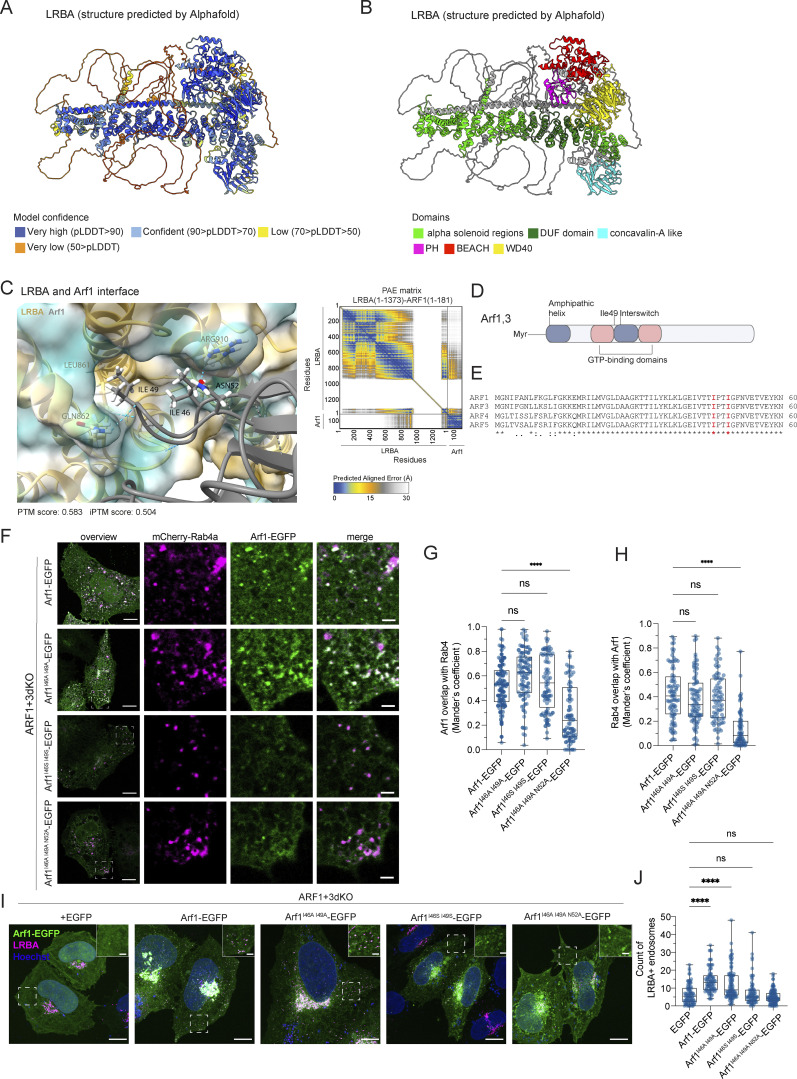
Figure 8.
Structure of LRBA and potential interaction site with Arfs as predicted by Alphafold. (A and B) Alphafold monomer prediction of human LRBA structure. Model confidence values (A) and domains (B) are indicated with colors. (C) Predicted interaction sites between LRBA (amino acids 1–1373) and Arf1 (amino acids 1–181) using Alphafold multimer. PAE plot shows the confidence scores of the interaction. The LRBA–ARF1 model has PTM and iPTM scores of 0.583 and 0.504, respectively. (D) Schematic of Arf1/3 structure and its domains. The conserved amino acid isoleucine 49 of Arf1/3 is shown since most of our models indicated that it could potentially interact with LRBA. (E) The predicted LRBA interaction site of Arf1, isoleucine 46 and 49 are conserved among human Arf1, Arf3, Arf4, and Arf5. Sequence alignments were performed using Clustal Omega. Labels: (*) conserved sequence; (:) conservative mutation; (.) semi-conservative mutation; (-) gap. (F) Colocalization analysis of mutated Arf1-EGFP constructs with Rab4+ endosomes. ARF1+3dKO HeLa cells were transfected with mCherry-Rab4a and with Arf1-EGFP constructs. Confocal images of single focal planes. Scale bar, 10 μm, inlays 2 μm. (G and H) Colocalization measurement of Rab4 and Arf1 mutants determined by Mander’s coefficients. Arf1I46A, I49A-EGFP and Arf1I46S, I49S-EGFP are still efficiently recruited to Rab4+ endosomes. Arf1I46A, I49A, N52A-EGFP recruitment to Rab4 endosomes is strongly reduced compared with wild-type Arf1-EGFP. Arf1-EGFP = 42 cells, Arf1I46A, I49A-EGFP = 43 cells, Arf1I46S, I49S-EGFP = 38 cells, and Arf1I46A, I49A, N52A = 36 cells were analyzed from n = 3 biological replicates, one-way ANOVA using Tukey’s multiple comparison test; ****P < 0.0001. (I) Arf1I46S, I49S-EGFP fails to rescue LRBA+ puncta in ARF1+3 dKO cells. ARF1+3 dKO cells were transfected with EGFP, Arf1-EGFP, Arf1I46A, I49A-EGFP, Arf1I46S, I49S-EGFP or with Arf1I46A, I49A, N52A-EGFP, fixed and stained for endogenous LRBA and with Hoechst. Scale bar, 10 μm, inlays 2 μm. (J) Quantification of the number of LRBA+ puncta based on images as shown on panel I. Two ROIs at the cell periphery per cell were analyzed. Mean and minimum to maximum are shown, box ranges from the first (Q1–25th percentiles) to the third quartile (Q3–75th percentiles) of the distribution. All data points are shown. EGFP = 42 cells, Arf1-EGFP = 39 cells, Arf1I46A, I49A-EGFP = 48 cells, Arf1I46S, I49S-EGFP = 36 cells, Arf1I46A, I49A, N52A = 49 cells were analyzed from n = 3 independent experiments; Kruskal–Wallis test using Dunn’s multiple comparison, ****P < 0.0001. EGFP and Arf1-EGFP measurements are identical to the one shown in Fig. 7 G as the data were obtained in the same experiment.

