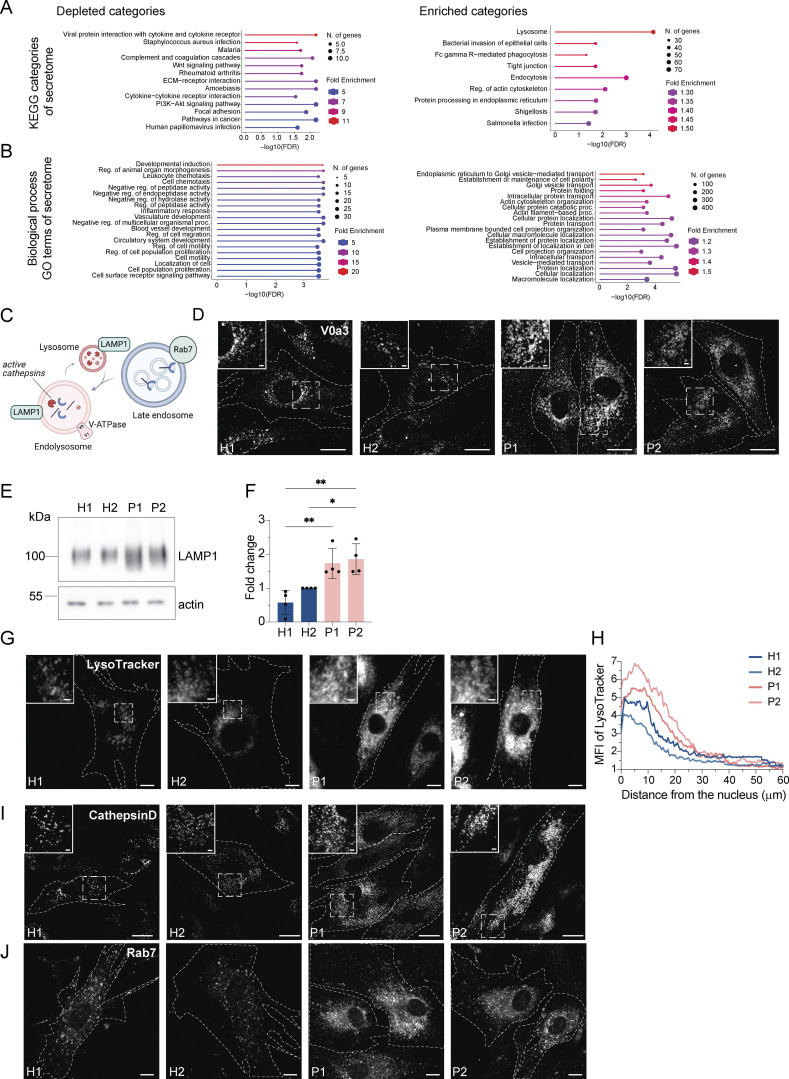
Figure S2.
Enlarged (endo)lysosomal structures are acidified and contain active cathepsin D. (A) Gene ontology analysis of enriched and depleted KEGG categories in the patients’ secretome. (B) Gene ontology analysis of enriched and depleted biological processes in the patients’ secretome. (C) Scheme showing Rab7+ late endosome fusing with LAMP1+ lysosomes and becoming endolysosomes. Endolysosomes are acidified and contain active cathepsins in their lumen and vacuolar-ATPase and LAMP1 in their membrane. (D) Visualization of endolysosomes by immunostaining the V0a3 subunit of the lysosomal V-ATPase. Healthy and LRBA-deficient fibroblasts were fixed and stained with V0a3 antibody. Representative confocal images. Cell outlines are marked with a dashed line. Inlays are shown in the top left corner of the images. Scale bar, 10 μm, inlays 2 μm. (E) Immunoblot analysis of LAMP1 protein levels in two healthy and two LRBA-deficient patient-derived fibroblast lines. Actin was used as a loading control. (F) Quantification of LAMP1 levels based on immunoblots shown on panel E from n = 4 biological replicates; one-way ANOVA using Tukey’s multiple comparison; *P = 0.0279, **P = 0.0036 (H1 versus P1), **P = 0.0017 (H1 versus P2). (G) Accumulation of acidified endolysosomes in LRBA-deficient fibroblasts. Fibroblasts were seeded onto imaging chambers, stained with LysoTracker Green and imaged live at 37°C and 5% CO2 atmosphere. Maximum Z-projection of wide-field images are shown. Cell outlines are marked with a dashed line. Inlays are shown in the top left corner of the images. Scale bar, 10 μm, inlays 2 μm. (H) Quantification of the LysoTracker Green intensity along the nucleus-cell periphery axis. A line ROI was drawn from the edge of the nucleus to the cell periphery and LysoTracker Green intensity was measured. Values were normalized to the maximum of each cell and averaged per experiment. The normalized mean of n = 3 biological replicates is plotted along the axis; H1 = 30 cells, H2 = 30 cells, P1 = 30 cells, P2 = 30 cells were analyzed. (I) Cathepsin D is present in accumulating, enlarged (endo)lysosomes. Healthy and LRBA-deficient fibroblasts were fixed and stained with endogenous cathepsin D antibody. Representative confocal images from n = 3 biological replicates. Cell outlines are marked with a dashed line. Inlays are shown in the top left corner of the images. Scale bar, 10 μm, inlays 2 μm. (J) Immunofluorescence analysis of Rab7+ late endosomes in two HDs and two patient-derived fibroblast lines. Representative confocal images. Cell outlines are marked with a dashed line. Scale bar, 10 μm. Source data are available for this figure: SourceData FS2.

