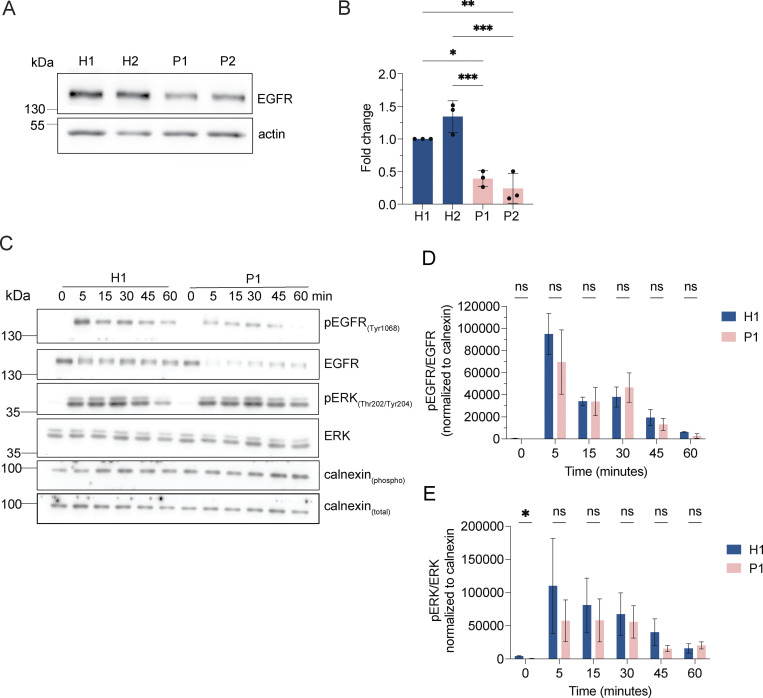
Figure S3.
LRBA does not regulate EGFR signaling attenuation. (A) EGFR protein levels are reduced in LRBA-deficient fibroblasts. Immunoblot analysis of EGFR in two healthy and two LRBA-deficient patient-derived fibroblast lines. Actin was used as a loading control. The same blot has been re-probed with LRBA antibody and is shown in Fig. 1 C, therefore the loading control (actin) is identical on the two images. (B) Quantification of EGFR levels based on immunoblots shown on panel A from n = 3 biological replicates; one-way ANOVA using Tukey’s multiple comparison; *P = 0.0124, **P = 0.0034, ***P = 0.0008 (H2 versus P1), ***P = 0.0003 (H2 versus P2). (C) Immunoblot analysis of EGFR signaling kinetics in H1 and P1 fibroblasts. Cells were serum-starved overnight in DMEM and then incubated with 2 μg/ml EGF in serum-free DMEM for the indicated time points. Cells were then rinsed with ice-cold PBS and lysed with M-PER lysis buffer supplemented with protease and phosphatase inhibitors. For addressing EGFR signaling, an antibody against EGFR and its phosphorylation site Tyr1068 was used. We also detected the downstream ERK phosphorylation with the Thr202/Tyr204 phosphorylation sites specific antibody. Calnexin was used as loading control. (D) Quantification of pEGFR levels and kinetics upon EGF stimulation based on immunoblots shown in A. pEGFR and EGFR levels were measured and normalized to calnexin loading controls (pEGFRnorm, EGFRnorm). Then pEGFRnorm values were normalized to EGFRnorm values and plotted over time. Two-way ANOVA using Šidák’s multiple comparisons test. (E) Quantification of pERK levels and kinetics upon EGF stimulation based on immunoblots as shown in A. pERK and total ERK levels were measured and normalized to calnexin loading controls (pERKnorm, ERKnorm). Then pERKnorm values were normalized to ERKnorm values and plotted over time. Two-way ANOVA using Šidák’s multiple comparisons test. *P = 0.0448. Source data are available for this figure: SourceData FS3.

