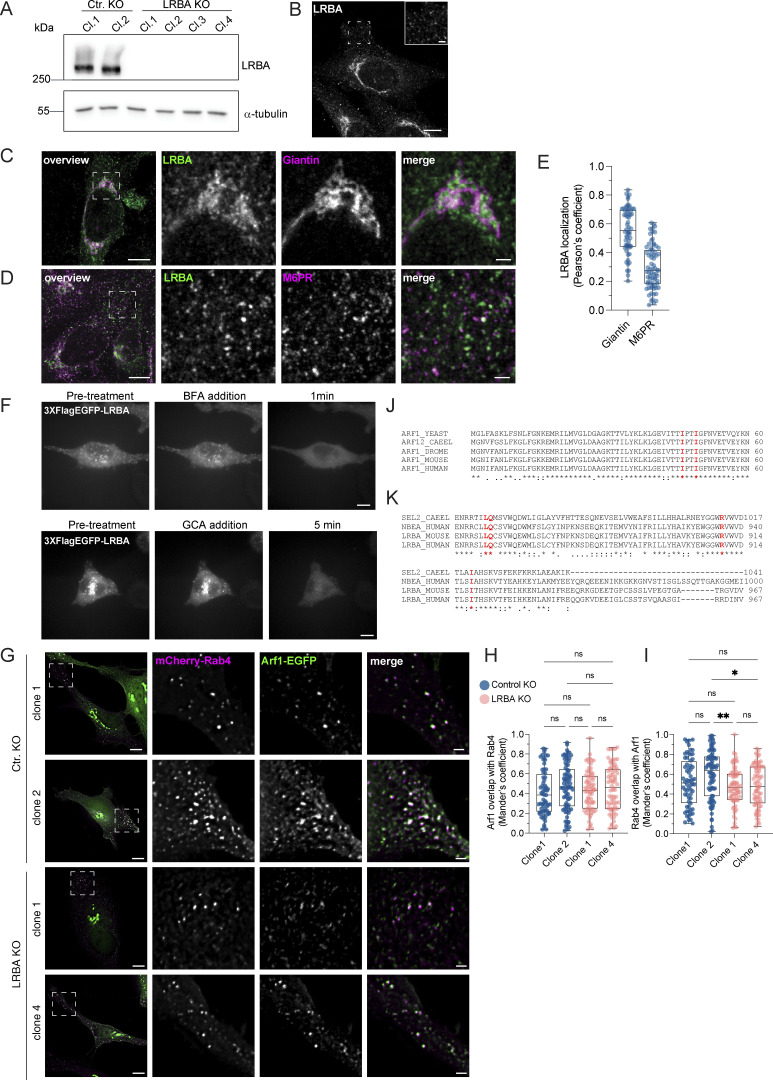
Figure S5.
LRBA is endogenously expressed in HeLa cells and recruited to endosomes by Arfs. (A) Immunoblot analysis of LRBA presence in HeLa cells of two control and four LRBA KO clones using polyclonal LRBA antibody and α-tubulin as a loading control. (B) LRBA is localized at the perinuclear region and on vesicular structures in HeLa cells. Immunofluorescence analysis of endogenous LRBA in fixed HeLa cells. Scale bar, 10 μm, inlay 2 μm. (C) LRBA partly colocalizes with the cis-Golgi in HeLa cells. Immunofluorescence staining of endogenous LRBA and the cis-Golgi marker giantin in fixed HeLa cells. Squares show magnification of the perinuclear area. The labeling of the single channels represents the color of the channel on the merged image. Scale bar, 10 μm, inlays 2 μm. (D) LRBA does not colocalize with M6PR in HeLa cells. Immunofluorescence analysis of endogenous LRBA and endogenous M6PR colocalization in fixed HeLa cells. Squares show magnification of the perinuclear area. The labeling of the single channels represents the color of the channel on the merged image. Scale bar, 10 μm, inlays 2 μm. (E) Colocalization measurement of LRBA with giantin and M6PR. To measure LRBA colocalization with giantin one ROI at the perinuclear region was analyzed. To measure colocalization with M6PR, two ROIs per cell at the cell periphery were analyzed and the Pearson’s coefficient was measured using the JACoP plugin in Fiji. Mean and minimum to maximum are shown, box ranges from the first (Q1–25th percentiles) to the third quartile (Q3–75th percentiles) of the distribution. All data points are shown. Giantin = 60 cells, M6PR = 35 cells. (F) LRBA puncta disperse upon treatment with ArfGEF inhibitors. Live-cell imaging of 3xFlagEGFP-LRBA upon BFA (top panels) and GCA (lower panels) treatment for indicated timepoints. Scale bar, 10 μm. (G) Arf1 is recruited onto Rab4+ endosomes in the absence of LRBA. Control KO and LRBA KO HeLa cells were transfected with mCherry-Rab4 and Arf1-EGFP and cells were imaged live using a wide-field microscope at 37°C, 5% CO2 atmosphere. Deconvolved images of single stacks are shown. Squares show magnification of the perinuclear area. The labeling of the single channels represents the color of the channel on the merged image. Scale bar, 10 μm, inlays 2 μm. (H and I) Colocalization measurement of Arf1-EGFP and mCherry-Rab4 in control and LRBA KO HeLa cells. Two ROIs per cell were analyzed and Mander’s coefficients were measured using the JACoP plugin in Fiji. Arf1 overlap with Rab4 (M1) is shown in H, Rab4 overlap with Arf1 (M2) is shown in I. All data points are shown. Ctr. KO clone1 = 32 cells, Ctr. KO clone2 = 39 cells, LRBA KO clone1 = 36 cells, LRBA KO clone 4 = 36 cells from n = 3 biological replicates; (H) one-way ANOVA using Tukey’s multiple comparison. (I) Kruskal–Wallis test using Dunn’s multiple comparisons test, **P = 0.0071, *P = 0.0201. (J) The amino acids isoleucine 46 and 49 of Arf1 and Arf3 were predicted to interact with LRBA. Both amino acids are conserved across species. The amino acid sequences of the yeast, C. elegans (CAEEL), Drosophila melanogaster (DROME), mouse and human Arf1 and human Arf3 were aligned. Labels: (*) conserved sequence; (:) conservative mutation; (.) semiconservative mutation; (−) gap. Sequence alignments were performed using Clustal Omega. (K) The amino acids leucine 861, arginine 910, and isoleucine 918 of LRBA were predicted to interact with Arf1 and Arf3. All three amino acids are conserved across species. The amino acid sequences of the C. elegans SEL-2 (SEL2-CAEEL), the mouse and the human LRBA, and the human neurobeachin (NBEA) were aligned. Labels: (*) conserved sequence; (:) conservative mutation; (.) semi-conservative mutation; (-) gap. Sequence alignments were performed using Clustal Omega. Source data are available for this figure: SourceData FS5.

