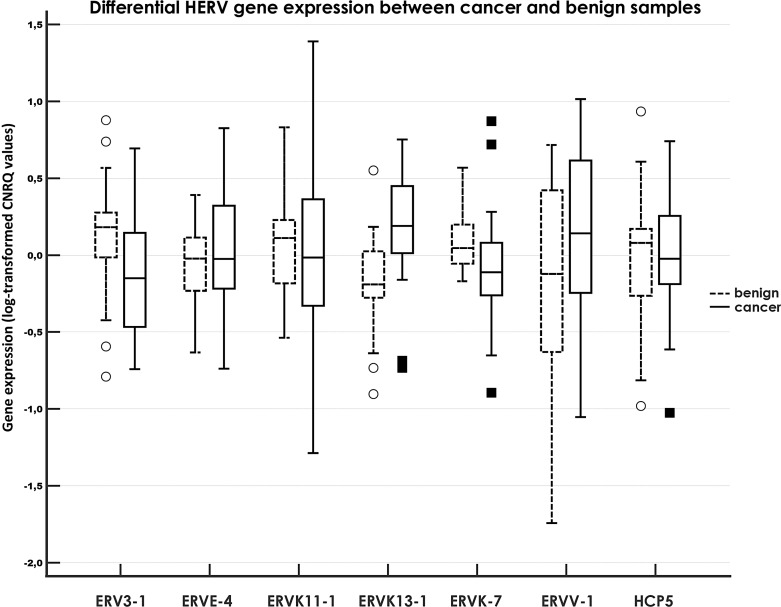
Fig. 1.
Relative expression of HERV genes compared between tumor samples of breast cancer patients and benign tissue samples. A clustered multiple-comparison graph showing RNA expression data (log-transformed CNRQ). A box of the box plot is drawn from the 1st to 3rd quartile (the 25th and 75th percentiles). A horizontal line within a box plot represents the median. Horizontal lines are drawn at the highest value and the lowest expression value. A circle/square represents an outside value. CNRQs, calibrated normalized relative quantities calculated by qbase+.

