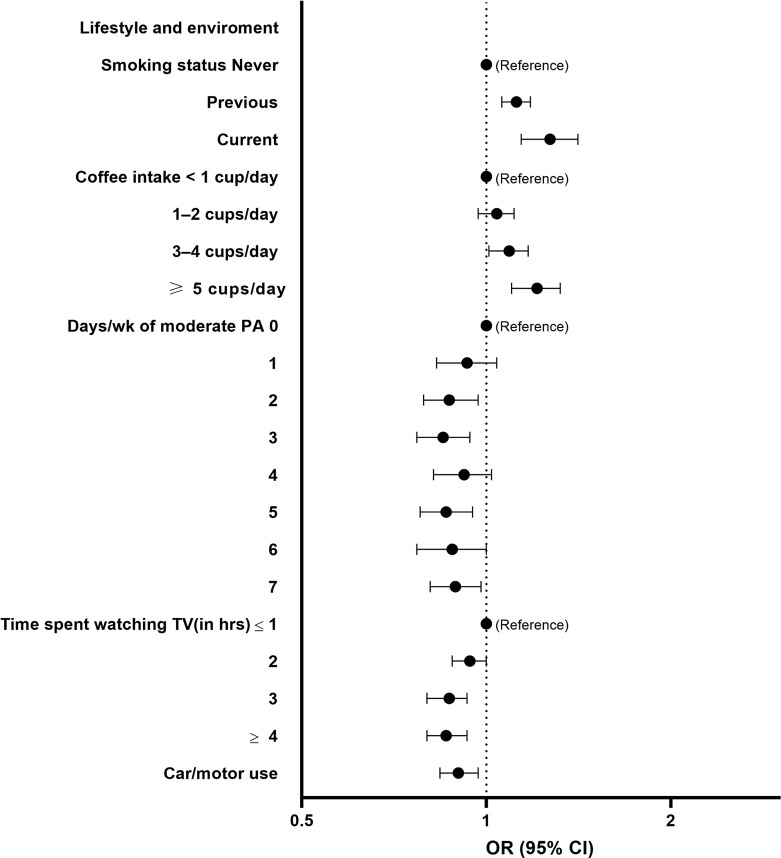
Fig. 3.
Forest plots showing the OR and 95% CI for low HV risk (reference group as indicated) determined by logistic regression for selected SHAP-important lifestyle and environment-related features. Analyses adjusted for sex, age, assessment centre, Townsend deprivation index, education, ethnicity, employment, and duration until imaging. Q1 to Q5 represent quintiles from lowest to highest values. CI, confidence interval; OR, odds ratio; PA, physical activity; TV, television.

