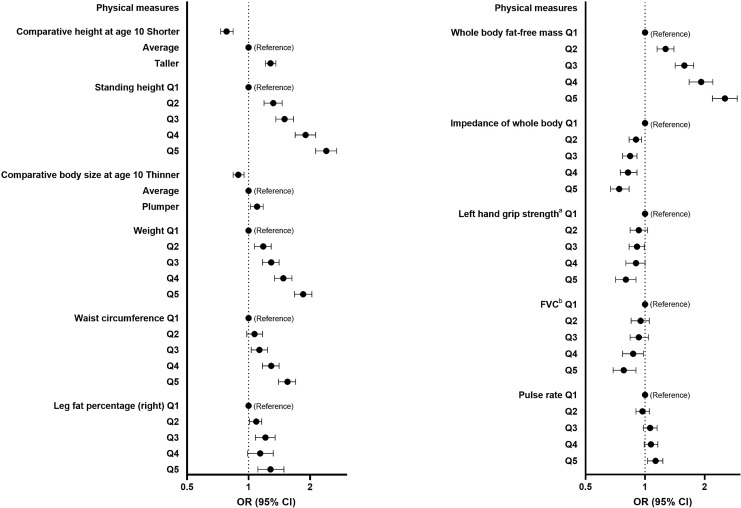
Fig. 4.
Forest plots showing the OR and 95% CI for low HV risk (reference group as indicated) determined by logistic regression for selected SHAP-important physical measures/features. Analyses adjusted for sex, age, assessment centre, Townsend deprivation index, education, ethnicity, employment, and duration until imaging. Q1 to Q5 represent quintiles from lowest to highest values. CI, confidence interval; FVC, forced vital capacity; OR, odds ratio. Left hand grip strengtha indicates further adjustment for height and weight and FVCb indicates further adjustment for height.

