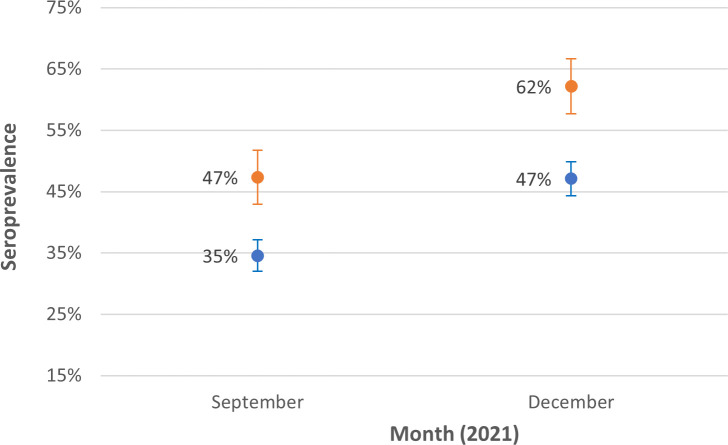
Fig 1.
SARS-CoV-2 infection-induced seroprevalence among specimens from individuals aged 5–17 years collected in ZCTAs with a full school mask policy and in ZCTAs with no school mask policy during September 1–30, 2021 and December 15, 2021 to January 14, 2022. Note: These descriptive statistics of seroprevalence is estimated with survey weights adjusting for age, sex, and metro status. Lines represent 95% confidence interval (CI).

