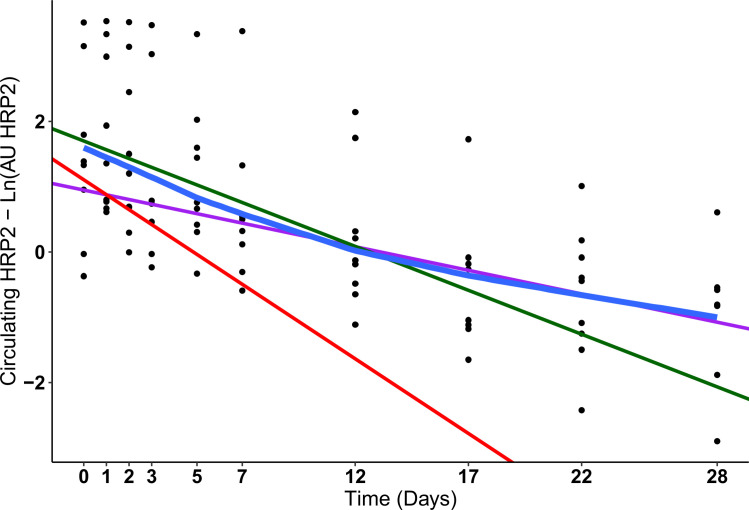
Fig 3.
Short- and Long-term decay of HRP2. The concentration of HRP2 in the capillary blood of patients without gametocytes after treatment, no recrudescence or reinfection, and detectable HRP2 levels for more than 7 days post-treatment initiation were selected for the generation of the long- and short-term models (N = 9). The blue line represents a lowess regression (locally weighted scatterplot smoothing). The purple line is the linear regression from the HRP2 values at day 12, day 17, day 22, and day 28 that shows the terminal elimination. The green line is the linear regression from the HRP2 values on day 0, day 1, day 2, day 3, day 5, and day 7 showing a mix of the initial parasite elimination and the terminal elimination. The red line represents the corrected initial HRP2 elimination after subtracting the contribution of the terminal elimination.

