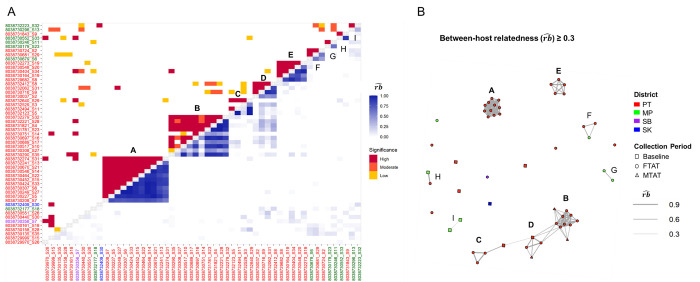
Fig 2. Between-host relatedness estimated by Dcifer.
(A) Estimates from the lower triangle represent between-host relatedness () across all parasites in each pair of infections, where 0 signifies completely unrelated infections, and 1 signifies completely related infections. The upper triangle indicates significance level: high significance (p < 0.001), moderate significance (0.001 ≤ p < 0.01), low significance (0.01 ≤ p < 0.05). Cases are ordered by clustered levels, and the colors of labels indicate the districts of origin for positive cases (PT = Pathoomphone, MP = Moonlapamok, SB = Sanasomboon, and SK = Sukhuma). Five large, highly related clusters (A to E marked in bold) with high statistical significance are identified, along with four smaller clusters (F to I). (B) Network plot: Lines connect nodes (cases) representing pairs with significant relatedness above 0.3, and line width reflects the strength of relatedness. Node colors correspond to the districts of positive cases, also indicated by the axis labels in plot A. Different shapes represent sample collection periods: Baseline (2017/11-12), Focal Test and Treat (FTAT, 2018/03-11), and Mass Test and Treat (MTAT, 2018/06-07).

