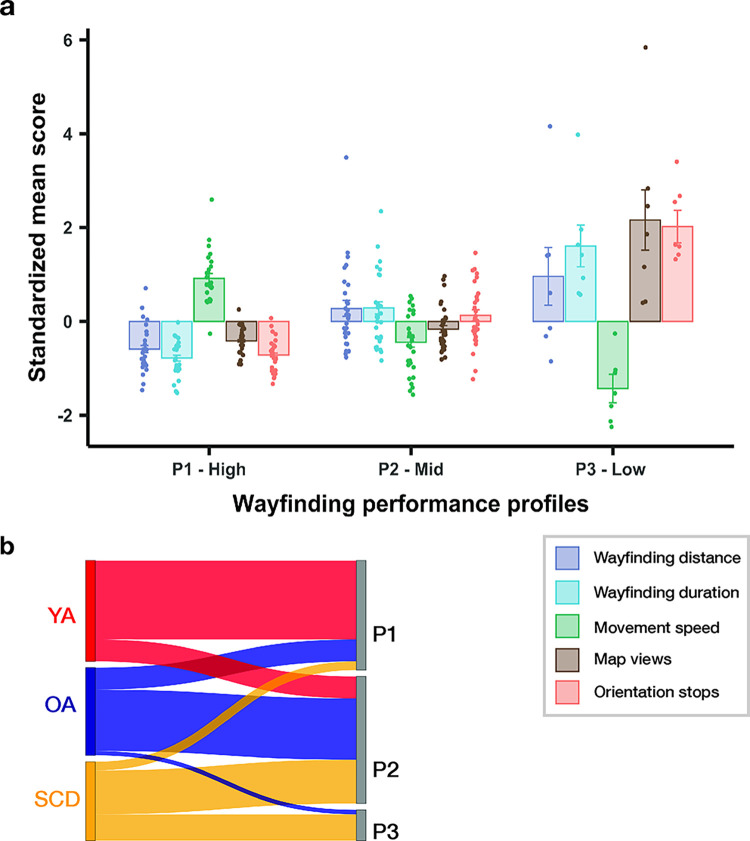
Fig 3. Three wayfinding performance profiles in our sample (P1: high-level; P2: mid-level; P3: low-level) as identified by a latent profile analysis (LPA) using five performance measures as input features.
(a) Means (± standard error) of the z-scored performance measures for each profile (purple: wayfinding distance; light blue: wayfinding duration; green: movement speed; brown: number of map views during walking; orange: number of orientation stops). (b) Sankey diagram showing the distribution of our participant classes in each wayfinding performance profile. Red: younger adults; blue: healthy older adults; yellow: patients with subjective cognitive decline.

