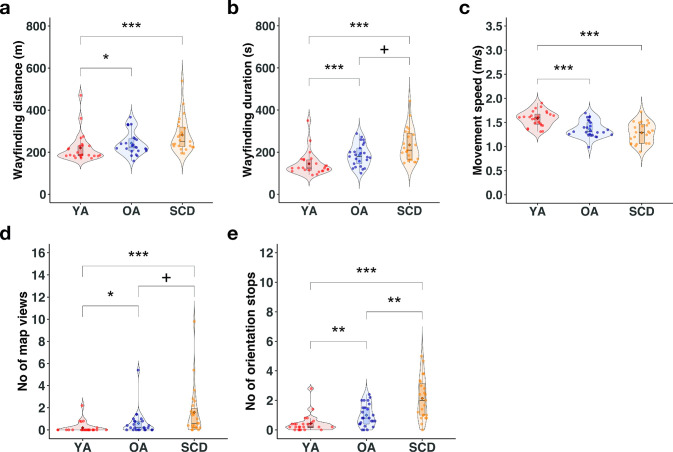
Fig 4. Results of the mixed effect model analyses.
Performance of the three groups (red: younger adults; blue: healthy older adults; yellow: patients with subjective cognitive decline) for the (a) wayfinding distance; (b) wayfinding duration; (c) movement speed; (d) number of map views during walking; (e) number of orientation stops (divided by the number of completed tracks). The boxplot denotes the lower and upper quartile of the measure; center line the median; whiskers the 1.5x interquartile range; dots the individual data points; diamond shape the mean; + p < .10; * p < .05; ** p < .01; *** p < .001.

