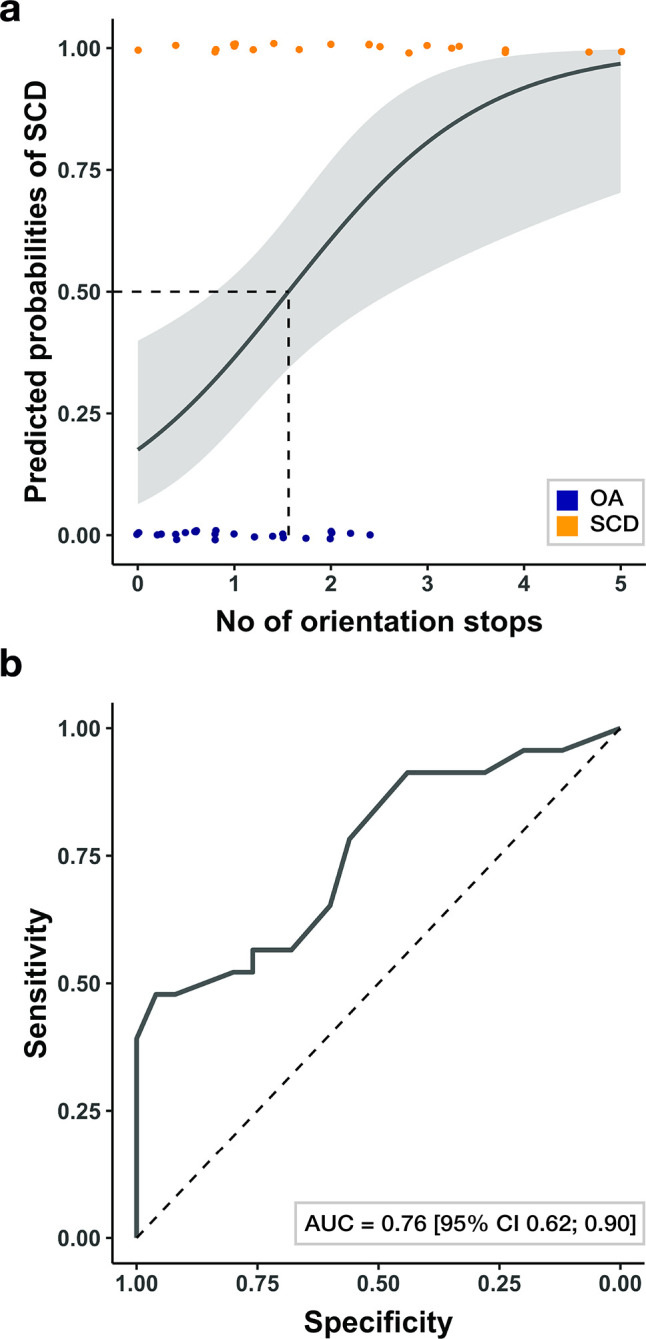
Fig 5. The number of orientation stops as predictor of SCD status in older adults.

(a) Predicted probabilities of being classified as a SCD patient, as estimated in a logistic regression model with the number of orientation stops as input feature. Shaded areas denote the 95% confidence intervals of the predictions and dots the individual data points (blue: healthy older adults; yellow: patients with subjective cognitive decline). (b) Receiver Operating Characteristic (ROC) curve showing the diagnostic accuracy of the number of orientation stops for the detection of SCD in older adults.
