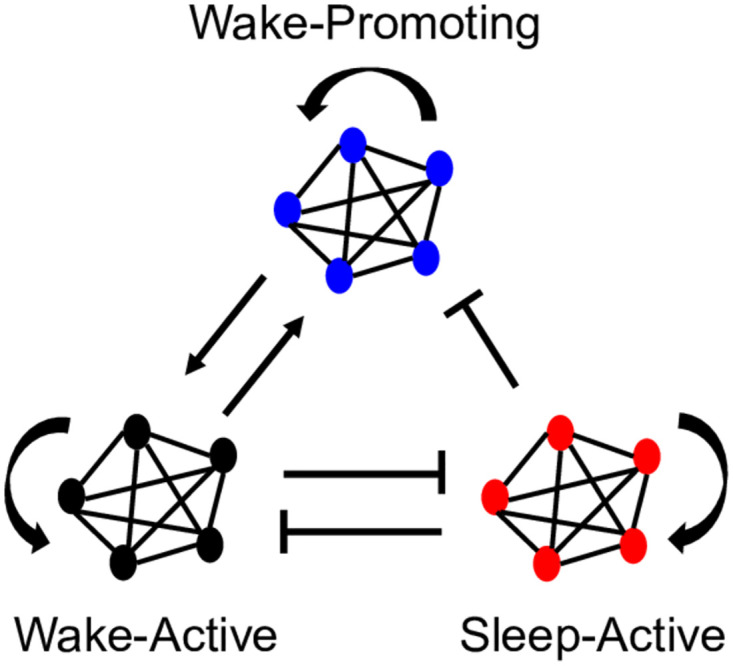
Fig 6. Neuronal network model including the wake-active, sleep-active, and wake-promoting brain regions.

We assign N neurons to each population with all-to-all connectivity (this figure shows N = 5). A pointed arrow indicates an excitatory connection between brain regions, and a blunted arrow indicates an inhibitory signal. These arrows represent neuronal connectivity in the brain, and each neuron is modeled with a leaky integrate-and-fire differential equation.
