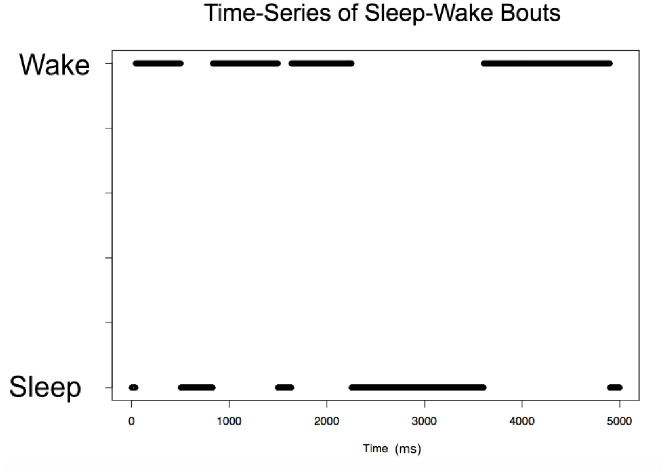
Fig 7. Switching between wake-active and sleep-active states.
In this representative time frame (no LC connectivity, N = 5 case), we observe switches between WA and SA states in the model, as observed in real data. Time is measured in milliseconds. The population with more spikes during a 30 ms sliding window is defined to be the active population.

