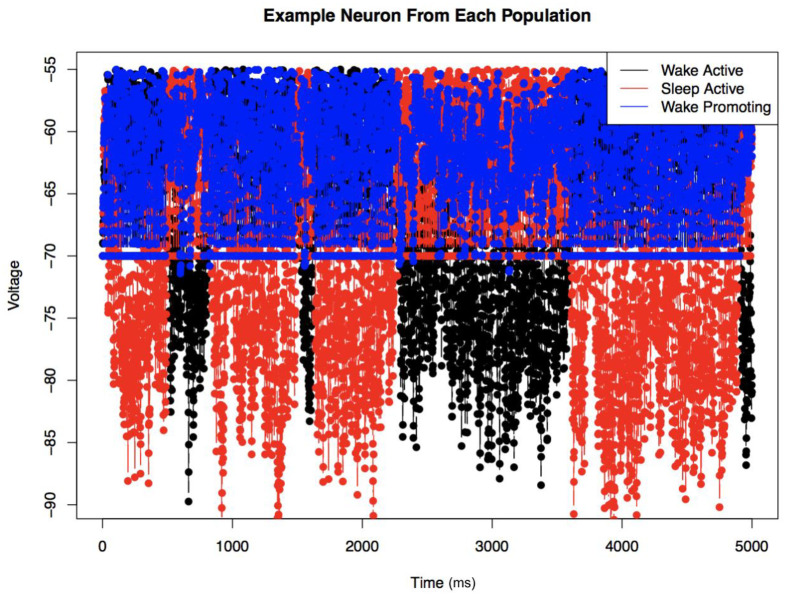
Fig 10. Voltage in a representative neuron from each population over time.
This shows the case of moderate LC connectivity (see Table 3 for parameter values, N = 5 case). This allows us to observe the switching behavior, but also the change in activity in the WP region during the different arousal states.

