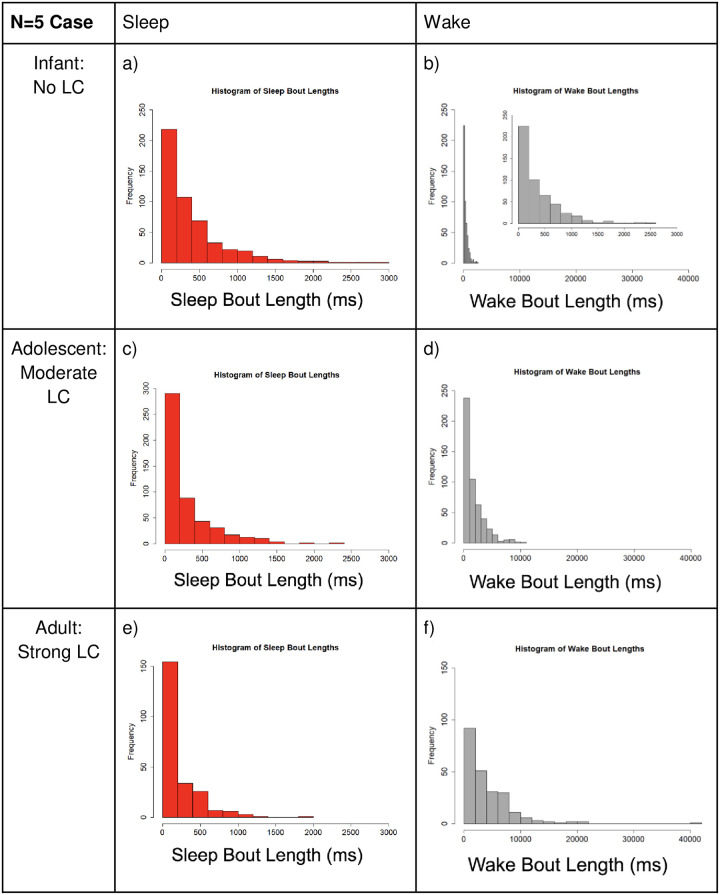
Fig 11. Small network comparison of the distribution of sleep and wake bout lengths.
Small network refers to the N = 5 case, and the level of LC connectivity increases as we move down the rows. Note the y-axis varies slightly between plots, but the x-axis stays consistent per neuron population for all cases. Left (SA case): We see that increasing the LC strength does not change the average bout length much, and the distribution maintains the original exponential shape. Right (WA case): Wake bout lengths get much longer on average as LC strength increases, and the shape of the distribution of bout lengths differs noticeably from the original exponential shape (no LC interaction). Note that the inlaid graph in panel b), we include a plot of the same data with the x-axis matching the SA case; this demonstrates that with no LC interaction, the WA and SA distributions are nearly identical. Large x-axis is used for WA plots to show the large increase in observed bout lengths as LC-WA interaction is increased.

