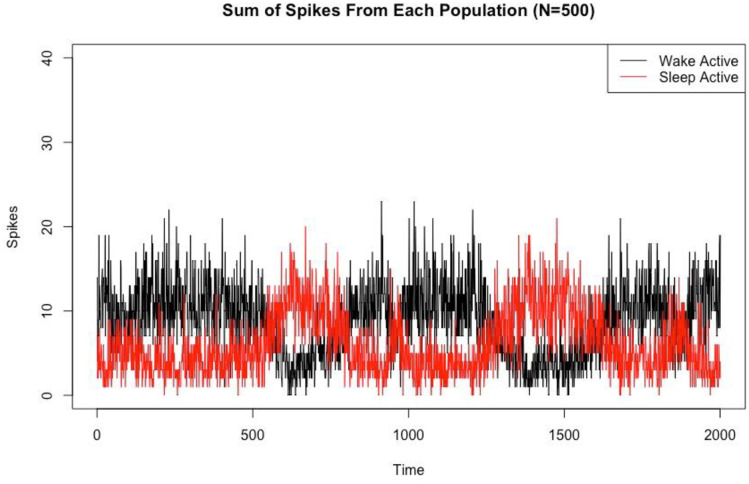
Fig 13. Switching behavior in the larger network model.
Sum of spikes from each population for the Strong LC case for N = 500 (we omit the wake promoting population for clarity). This allows us to observe the switching behavior between sleep and wake states. We calculate which behavioral state the system is in by using a 30ms sliding window and counting which population (WA or SA) has the larger number of spikes. Time is measured in milliseconds.

