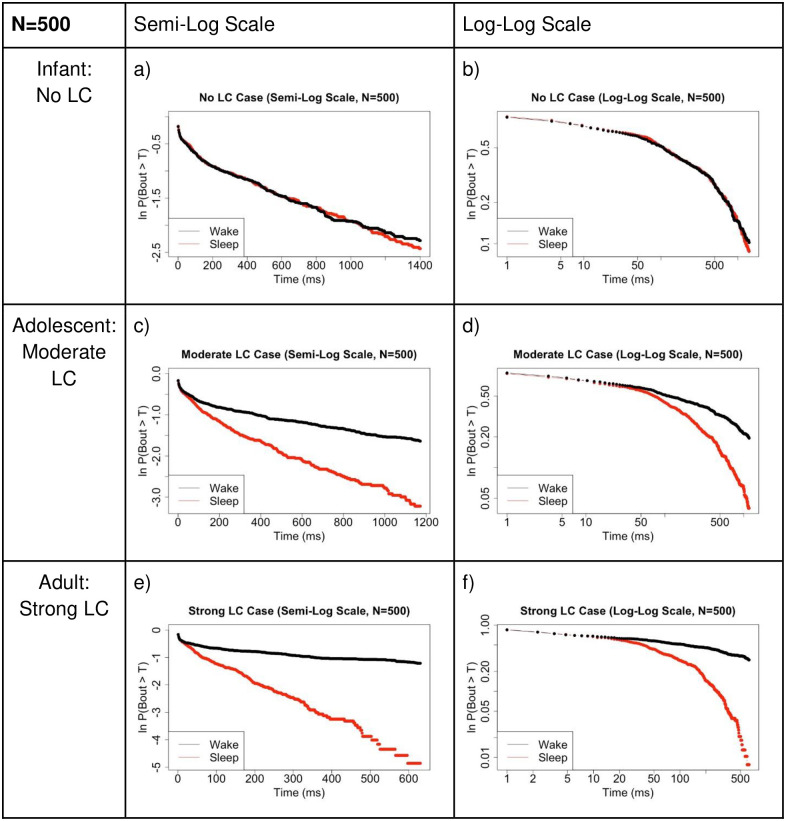
Fig 16. Larger network comparison of survivor plots.
Comparison of survivor plots of wake and sleep bout distributions as connectivity strength between the WA population and LC population is increased in multiple ways, N = 500 case. Left: Semi-log scale; Right: Log-log scale. We observe the predicted shift in wake bout distribution from exponential to power law-like once the model brain has reached ‘maturity’. Compare to Fig 12 which shows identical plots for the N = 5 case. We see maintenance of the network behavior at this much larger neuron population size. Refer to Fig 4 which shows that a power law distribution is linear on a log-log scale and an exponential distribution is linear on a semi-log scale. These data were obtained from 100,000 time step simulations.

