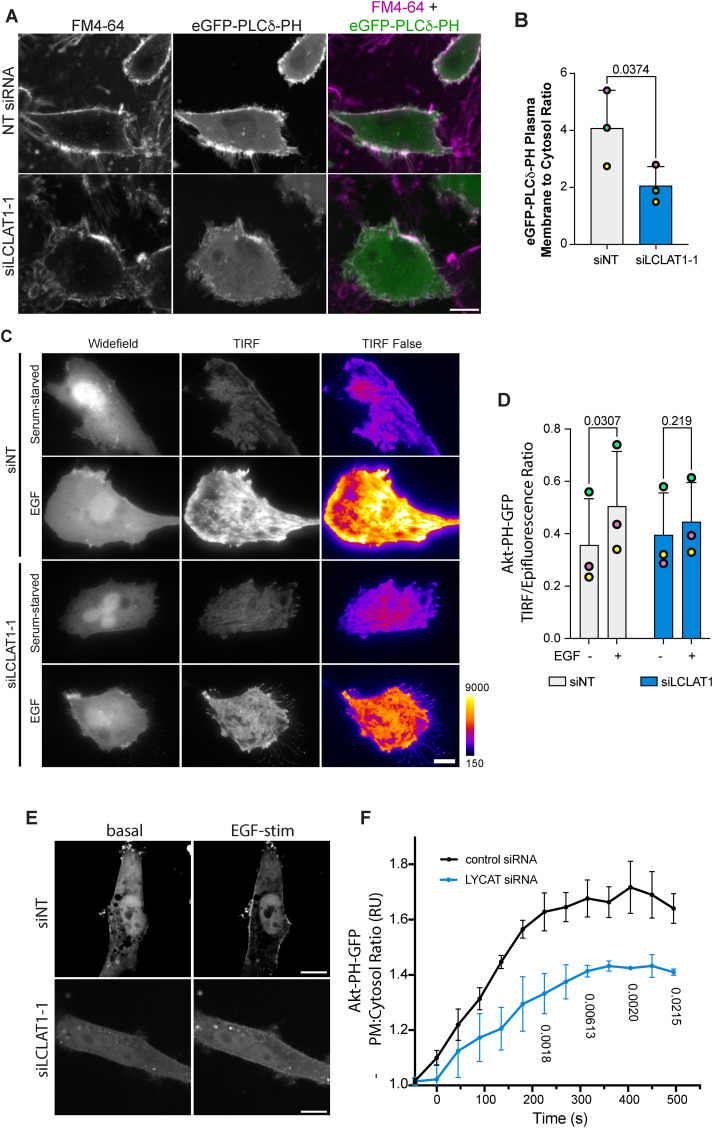
FIGURE 3:
Defective PI(4,5)P2 and EGF-stimulated PtdIns(3,4,5)P3 synthesis in LCLAT1-silenced cells. MDA-MB-231 cells (A, E), and ARPE-19 (C) were mock-silenced or LCLAT1-silenced. (A) Confocal images of MDA-MB-231 cells stably expressing eGFP-PLCδ-PH (green) and labeled with FM4-46FX (magenta). (B) Quantification of eGFP-PLCδ-PH fluorescence on FM4-64X–labeled cell periphery relative to its cytosolic signal. (C) TIRF and epifluorescence microscopy of ARPE-19 cells mock-silenced or silenced for LCLAT1 and expressing Akt-PH-GFP. Cells were maintained serum starved or exposed to 20 ng/ml EGF for 5 min. The TIRF field is shown both in grayscale and as false-color (fire LUT), where black-indigo is weakest and yellow-white is strongest. For representation, cells selected expressed similar levels of Akt-PH-GFP. (D) Quantification of TIRF/epifluorescence ratio of Akt-PH-GFP. Total Akt-PH-GFP fluorescence in TIRF field is expressed as a ratio against the corresponding total fluorescence in the epifluorescence field. Shown is the ratio for serum-starved and EGF-stimulated control and LCLAT1-silenced cells. (E) Spinning disk confocal images of MDA-MB-231 cells mock-silenced or LCLAT1-silenced before and during 20 ng/ml EGF stimulation. (F) Quantification of Akt-PH-GFP fluorescence at the plasma membrane relative to its cytosolic signal from time-lapse imaging over 10 min of stimulation with 20 ng/ml EGF. Scale bar = 20 µm. All experiments were repeated three independent times. For B and D, data points from matching independent experiments are color coded. Shown is the mean ± SEM, where data in D were binned every 45 s (three images). For B and D, data are based on 30–50 transfected cells per condition per experiment. For F, a total of 23 transfected cells were traced over time over three independent experiments. Data in B were analyzed by paired Student t test. For D and F, repeated measures two-way ANOVA and Sidak’s post-hoc test was used to test data in D. p values are shown.

