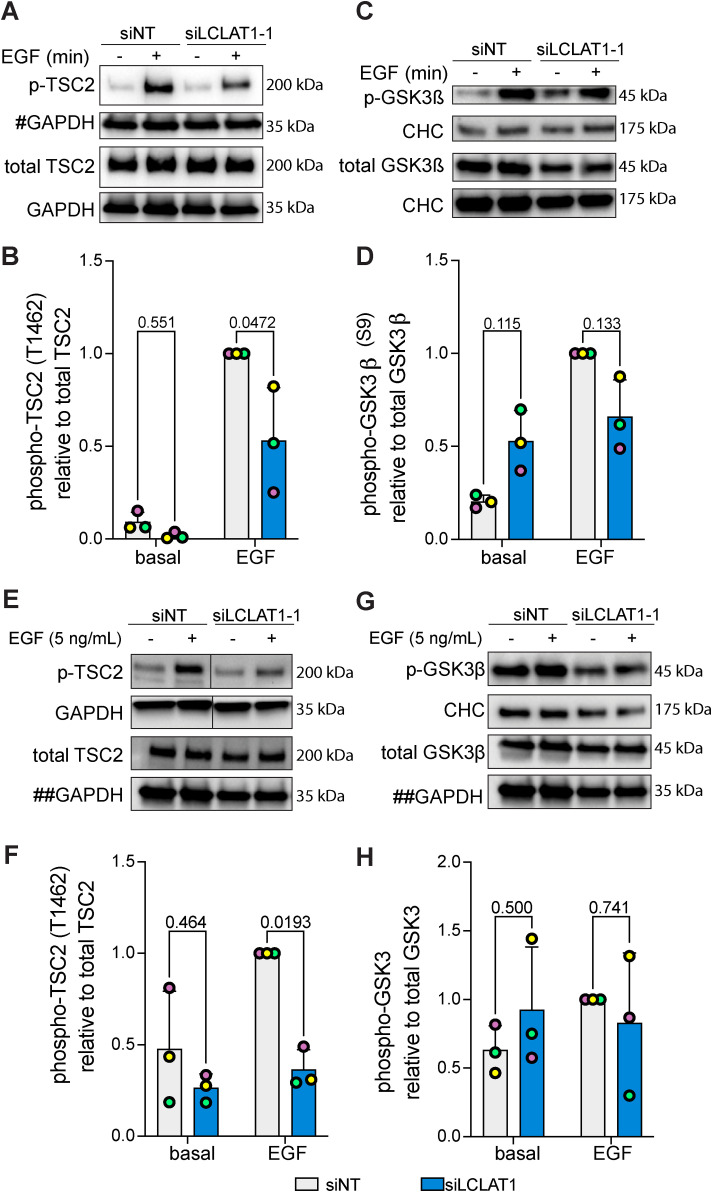
FIGURE 7:
LCLAT1 is required for activation of Akt substrates after EGF stimulation. (A, C) Mock-silenced and LCLAT1-silenced ARPE-19 cells were serum-starved (0 min) or stimulated with 5 ng/ml EGF for 5 min. Lysates were then separated by SDS–PAGE and probed by Western blotting for phospho-Tsc2 and total Tsc2 (A) and phospho-GSK3β and total GSK3β (C). Clathrin heavy chain (CHC) or GAPDH were used as loading controls. # indicates that the GAPDH blot was also used as loading control for total pan-Akt in Figure 5A since they originated from the same membrane cut across to probe for different sized proteins. (B, D) Quantification of pTsc2 (B) and pGSK3β (D) normalized to respective total Tsc2 and GSK3β. (E, G) Mock-silenced and LCLAT1-silenced MDA-MB-231 cells were serum-starved (0 min) or stimulated with 5 ng/ml EGF for 5 min. Lysates were then separated by SDS–PAGE and probed by Western blotting for phospho-Tsc2 and total Tsc2 (F), and phospho-GSK3β and total GSK3β (G). Clathrin heavy chain (CHC) or GAPDH were used as loading controls. ## indicates that the GAPDH blot was used as loading control for both total TSC2 (G) and total GSK3β (I) since they originated from the same membrane cut across to probe for different sized proteins. (H, J) Quantification of pTsc2 (H) and pGSK3β (I) normalized to respective total Tsc2 and GSK3β. For B, D, F, and H mean ± STD are shown from n = 3 independent experiments. Data points from matching independent experiments are color coded. A two-way ANOVA and Sidak’s post-hoc test was used to statistically test the data, with p values shown.

