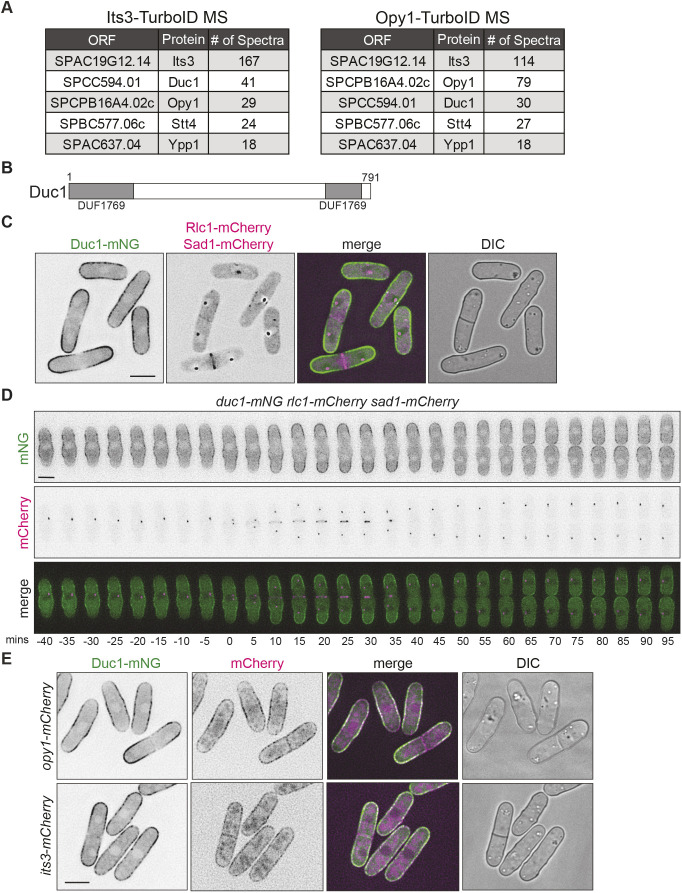
Fig. 1.
Duc1 localizes to the cell cortex. (A) Summary of data generated from proximity-dependent biotinylation experiments of Its3–TurboID and Opy1–TurboID. Number of spectra of selected proteins identified from mass spectrometry (MS) analysis is shown. (B) Schematic of Duc1, drawn to scale, with the split DUF1769 domain in gray. Numbers indicate amino acid residue positions. (C) Live-cell imaging of duc1-mNG rlc1-mCherry sad1-mCherry. (D) Live-cell time-lapse imaging of duc1-mNG rlc1-mCherry sad1-mCherry cells. Elapsed time is in minutes. Images were acquired every 5 min and time zero represents the first frame of SPB separation. (E) Live-cell imaging of Duc1–mNG with either Its3–mCherry or Opy1–mCherry. DIC, differential interference contrast image. Scale bars: 5 µm. Images in C–E are representative of two biological replicates.

