Fig. 3.
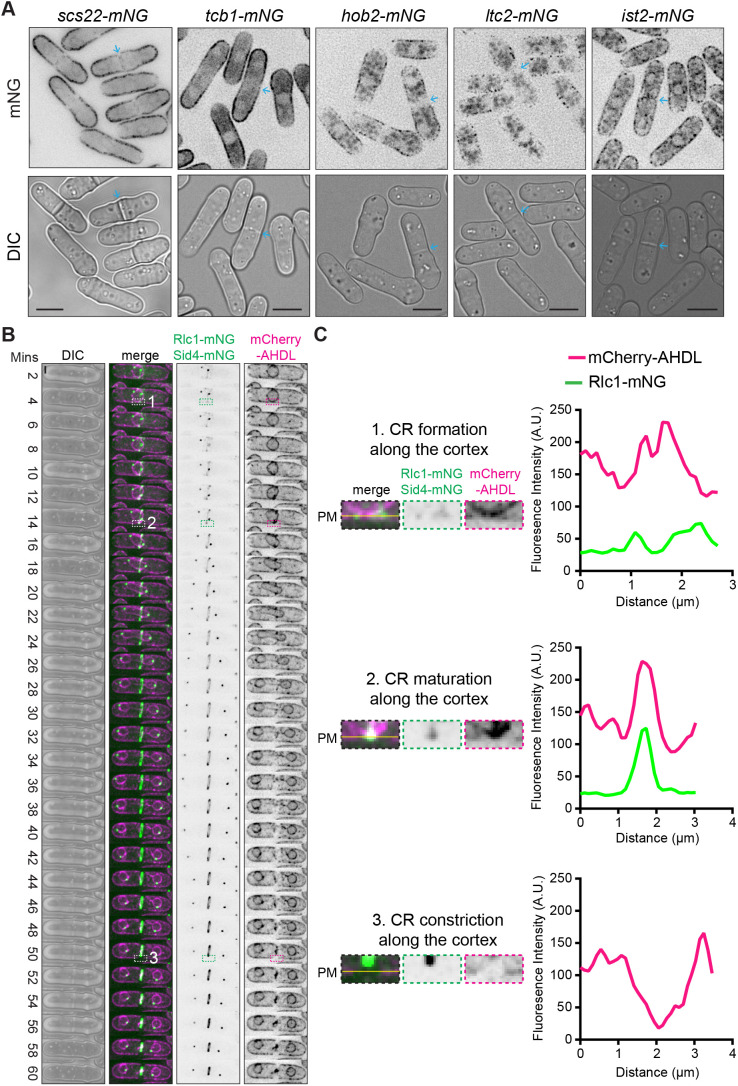
ER–PM contact site proteins are excluded from the cell division site. (A) Live-cell imaging of cells with the indicated mNG-tagged proteins. Blue arrows mark septa. Scale bars: 5 µm. Images are representative of two biological replicates. (B) Live-cell time-lapse imaging of cells expressing mCherry–AHDL, Rlc1–mNG and Sid4–mNG. Elapsed time is shown relative to SPB separation. Numbered boxes indicate regions shown in C. Scale bar: 2 µm. (C) Left, zoomed in views of the frames of the montage indicated in boxes numbered 1–3 from B. The yellow lines correspond to the position of the PM. Right, fluorescence line scan analysis of the frames on the right from the montages in B. Fluorescence intensity was plotted versus distance. Images and line scans in B and C are representative of two biological replicates. A.U., arbitrary units; DIC, differential interference contrast image.

