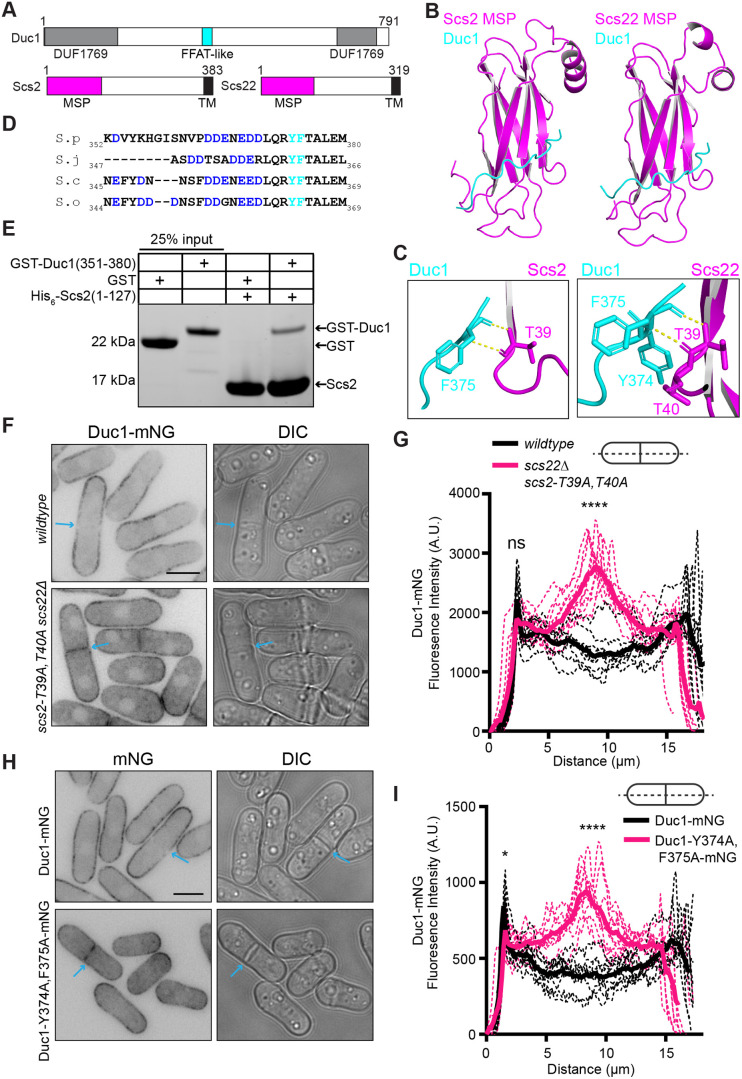
Fig. 4.
Duc1 is predicted to directly bind Scs2 and Scs22. (A) Schematic, drawn to scale, of Duc1, Scs2 and Scs22. The DUF1769 domain is gray, the FFAT-like sequence is cyan, the MSP domains are magenta, and the transmembrane (TM) domains are black. Numbers indicate amino acid residue positions. (B) AlphaFold2 prediction of the Duc1–MSP complexes. Full-length Duc1 and either Scs2 (amino acids 1–132; left) or Scs22 (amino acids 1–125; right) were modeled. Duc1 residues 364–376 are cyan and MSP domains are magenta. (C) Zoomed-in views of the Duc1–Scs2 (left) and Duc1–Scs22 (right) interaction interfaces. Residue predicted to directly bind are labeled. (D) Sequence alignment of the indicated Duc1 proteins. Acidic residues are in blue, and Y374 and F375 are cyan. Numbers indicate amino acid residue positions. S. pombe (S.p), Schizosaccharomyces japonicus (S.j), Schizosaccharomyces octosporus (S.o) and Schizosaccharomyces cryophilus (S.c) sequences are shown. (E) In vitro binding assay with bead-bound His6–Scs2(1–127) incubated with GST or GST–Duc1(351–380). Samples were washed three times and resolved by SDS-PAGE. The gel was stained with Coomassie Blue to visualize proteins. Gel shown is representative of three experiments. (F) Live-cell imaging of Duc1–mNG in wild-type or scs2-T39A, T40A scs22Δ cells. Blue arrows indicate a septum. (G) Fluorescence line scans drawn across the long axis of cells as in F. n=10 cells for each from two independent replicates. Solid lines represent the mean and dotted lines are the individual line traces. Wild-type cells versus scs22Δ scs2-T39A, T40A cells at first peak, 2.3 μm distance, P=0.051. Wild-type cells versus scs22Δ scs2-T39A, T40A cells at a medial distance, 8.9 μm, P<0.0001. ****P<0.0001; ns, not significant (unpaired, two-tailed Student's t-test). (H) Live-cell imaging of cells expressing Duc1–mNG or Duc1-Y374A, F375A–mNG. Blue arrows indicate a septum. (I) Fluorescence line scans drawn across the long axis of cells as in H. n=10 cells for each from two independent replicates. Solid lines represent the mean and dotted lines are the individual line traces. Duc1–mNG versus Duc1–Y374A, F375A at first peak, 1.58 μm distance, P<0.05. Duc1–mNG versus Duc1–Y374A, F375A at a medial distance, 8.35 μm, P<0.0001. *P<0.05; ****P<0.0001 (unpaired, two-tailed Student's t-test). Scale bars: 5 µm. A.U., arbitrary units; DIC, differential interference contrast image.

