Fig. 5.
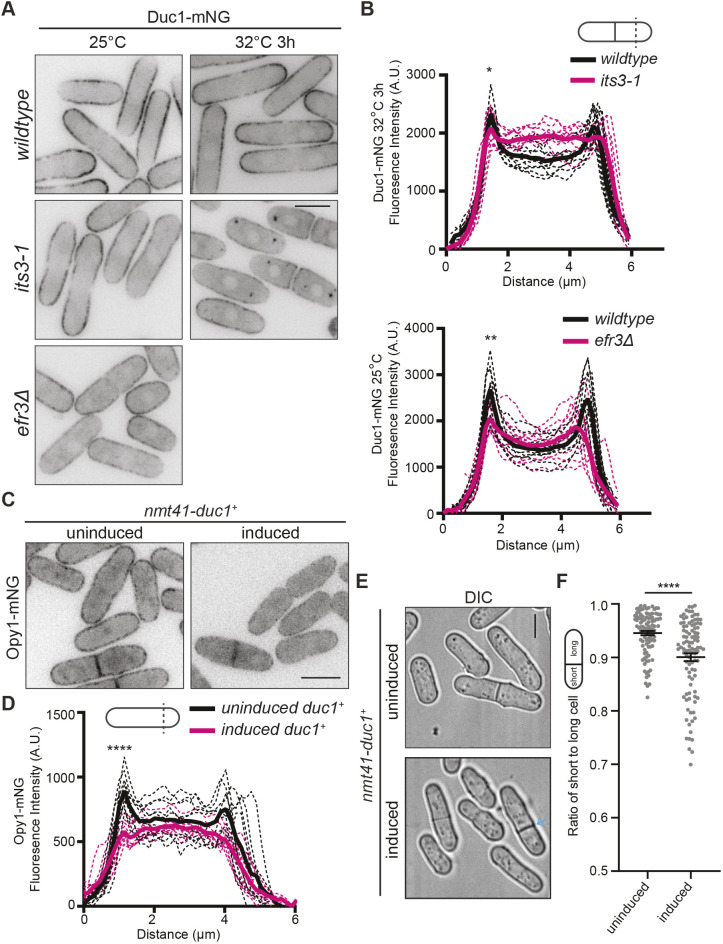
Duc1 behaves like a PI(4,5)P2-binding protein. (A) Live-cell imaging of Duc1–mNG in the indicated genetic backgrounds grown at the indicated temperatures. (B) Fluorescence line scans drawn across the short axis of cells as in A. n=10 cells for each from two independent replicates. Solid lines represent the mean and dotted lines are the individual line traces. Wild-type cells versus its3-1 cells at first peak, 1.44 μm distance, P<0.05. Wild-type cells versus efr3Δ cells at first peak, 1.58 μm distance, P<0.01. *P<0.05; **P<0.01 (unpaired, two-tailed Student's t-test). (C) Live-cell imaging of Opy1–mNG with nmt41-duc1+ expression either repressed (uninduced; grown with thiamine) or induced (grown without thiamine for 24 h) prior to imaging. (D) Fluorescence line scans drawn across the short axis of cells as in C. n=10 cells for each from two independent replicates. Solid lines represent the mean and dotted lines are the individual line traces. Uninduced versus induced at first peak, 1.15 μm distance, P<0.0001. ****P<0.0001 (unpaired, two-tailed Student's t-test). (E) Live-cell imaging of the indicated strains. duc1+ expression was either repressed (uninduced; grown with thiamine) or induced (grown without thiamine for 30 h) prior to imaging. The blue arrow marks an off-center septum. (F) Quantification of the ratio of short to long daughter cell length for strains as in E. Horizontal line marks the mean, and error bars represent the s.e.m. n≥99 for each from two independent replicates. ****P<0.0001 (unpaired, two-tailed Student's t-test). Scale bars: 5 µm. A.U., arbitrary units; DIC, differential interference contrast image.

