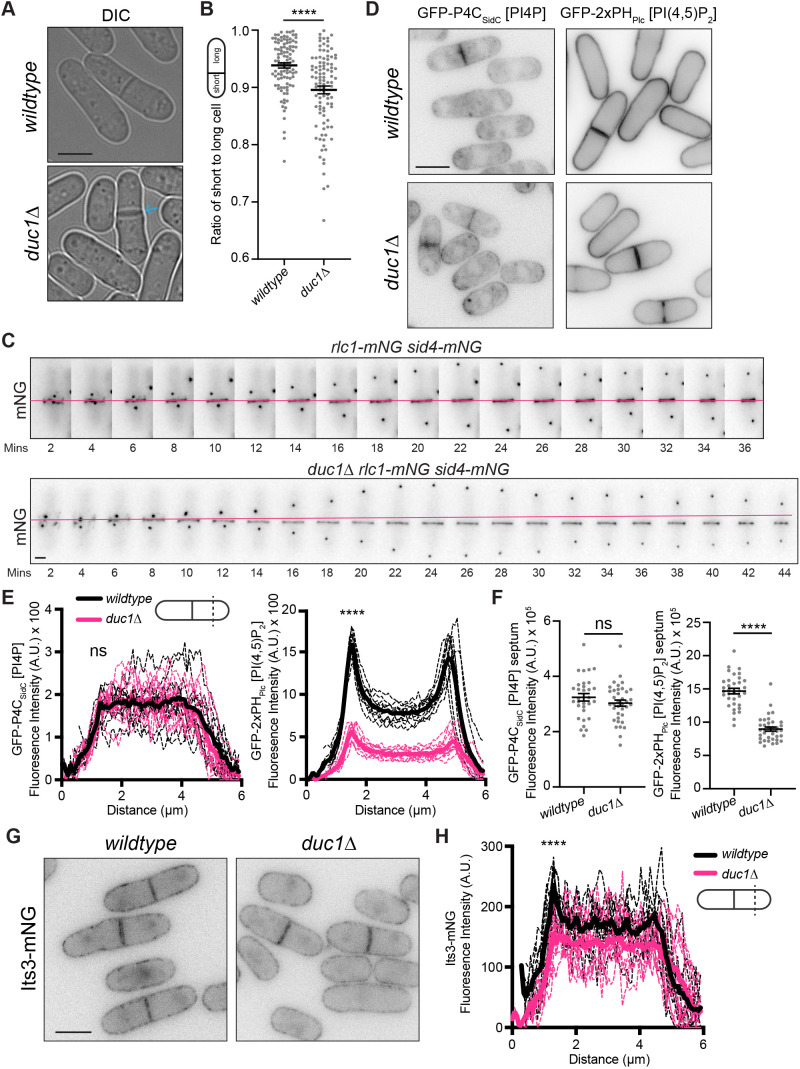
Fig. 6.
CR sliding is observed in duc1Δ mutant cells. (A) Live-cell imaging of the indicated strains. The blue arrow marks a septum. (B) Quantification of the ratio of short to long daughter cell length for strains as in A. Horizontal line marks the mean, and error bars represent the s.e.m. n=100 for each from two independent replicates. ****P<0.0001 (unpaired, two-tailed Student's t-test). (C) Live-cell time-lapse imaging of Rlc1–mNG and Sid4–mNG in wild-type or duc1Δ cells. Images were acquired every two minutes. Numbers indicate minutes elapsed; magenta line indicates the position where the CR was formed. Data is representative of four independent replicates. (D) Live-cell imaging of wild-type and duc1Δ cells expressing GFP–P4CSidC or GFP–2×PHPlc. (E) Fluorescence line scans drawn across the short axis of cells as in D. n=10 cells for each from three independent replicates. Solid lines represent the mean and dotted lines are the individual line traces. GFP–P4CSidC wild-type cells versus duc1Δ cells at first peak, 1.29 μm distance, P=0.754. GFP–2×PHPlc wild-type cells versus duc1Δ cells at first peak, 1.51 μm distance, P<0.0001. ****P<0.0001; ns, not significant (unpaired, two-tailed Student's t-test). (F) Fluorescence intensity of GFP–P4CSidC or GFP–2×PHPlc at the septum of wild-type or duc1Δ cells from D. Data is from three independent replicates and n≥30 for each. Horizontal line marks the mean, and error bars represent the s.e.m. Wild-type versus duc1Δ GFP–P4CSidC, P=0.23. Wild-type versus duc1Δ GFP–2×PHPlc, P<0.0001. ****P<0.0001; ns, not significant (unpaired, two-tailed Student's t-test). (G) Live-cell imaging of Its3–mNG in wild-type or duc1Δ cells. (H) Fluorescence line scans drawn across the short axis of cells as in G. n=10 cells for each from two independent replicates. Wild-type versus duc1Δ cells at first peak, 1.29 μm distance, P<0.0001. ****P<0.0001 (unpaired, two-tailed Student's t-test). Scale bars: 5 µm in A,D,G; 2 µm in C. A.U., arbitrary units; DIC, differential interference contrast image.

