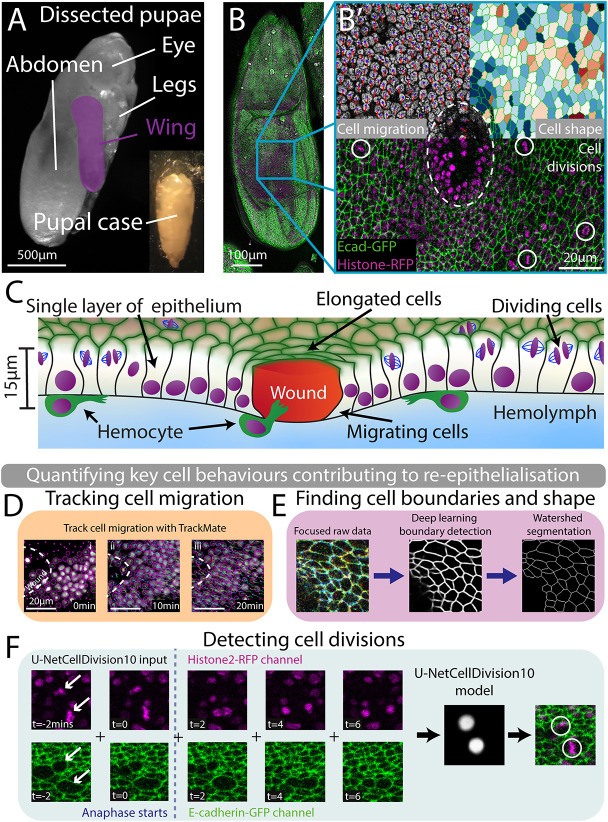
Fig. 1.
Live imaging of pupal wing wounds and automated quantification of the three cell behaviours contributing to re-epithelialisation. (A) Bright-field image of an 18 h APF (after puparium formation) pupa with the wing highlighted in magenta. (B) Tile scan of the full pupal wing. E-cadherin-GFP (green) shows cell boundaries and Histone2-RFP (magenta) labels cell nuclei. (B′) Wounded wing tissue with white dashed line showing the wound edge. The three cell behaviours involved in wound healing are shown in three segments. (Top left, cell migration) A close-up of the wounded epithelium in greyscale with cell nuclei marked with a mauve circle and the velocity of each nucleus indicated by a red line. The length of the line is proportional to the speed of that nucleus. (Top right, cell shape) Cells elongated perpendicular to the wounds and highlighted in blue; red indicates cells oriented towards the wound. (Bottom, cell divisions) Cell divisions are detected and highlighted with a white circle. (C) Cross-section of wounded 18 h APF pupal wing. (D) Snap shots from a movie of the wounded epithelium at timepoints indicated. Purple circles highlight detected nuclei and purple dots indicate a detected nuclei above or below the plane of view. White dashed lines indicate the wound edge. Nuclear tracks show cells moving towards the wound. (E) A three-focal plane image is inputted into the U-NetBoundary model and then segmented using Tissue Analyzer. (F) Our deep learning algorithm for detecting cell divisions in the wound epithelium. The model input has 10 frames, five each from the Histone2-RFP and E-cadherin-GFP channels. The model highlights (with a white spot) where it detects a division.

