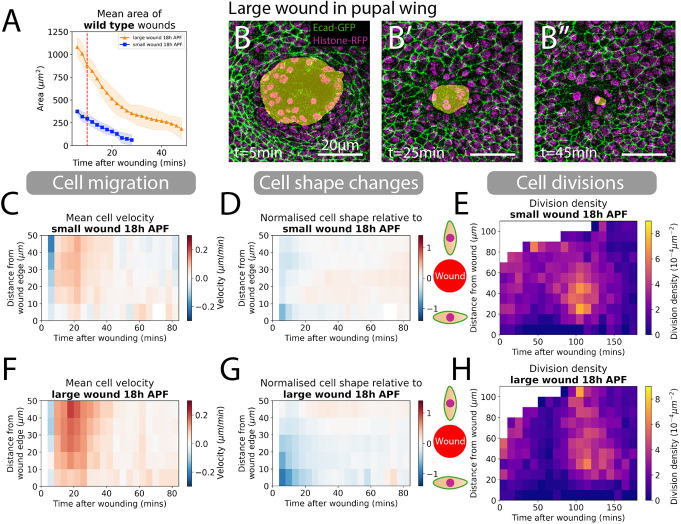
Fig. 2.
Quantifying cell migration, shape changes and divisions around small and large wounds. (A) Quantification of the wound area over time for both small and large wounds. The red dashed line is the 9-10 min point where we classify the size of wounds. (B-B″) A large wound, as visualised over three timepoints: 5 min, 25 min and 45 min. Yellow shading highlights non-epithelial tissue in images to illustrate wound closure over time. (C,F) Spatio-temporal heatmaps of cell velocity relative to wound centre for small and large wounds, respectively. Blue regions indicate cells that are migrating away from wounds and red regions indicate cells that are migrating towards the wound. (D,G) Spatio-temporal heatmaps of cell shape elongation relative to wounds for small and large wounds, respectively. Blue regions indicate that cells are elongated perpendicular to wounds and red indicates cells that are oriented towards the wound. (E,H) Heatmaps of the division density for small and large wounds. All heatmaps are weighted means of a cell behaviour for each wound video, with the weight corresponding to the visible area of tissue in videos. n=8 small wounds; n=9 large wounds.

