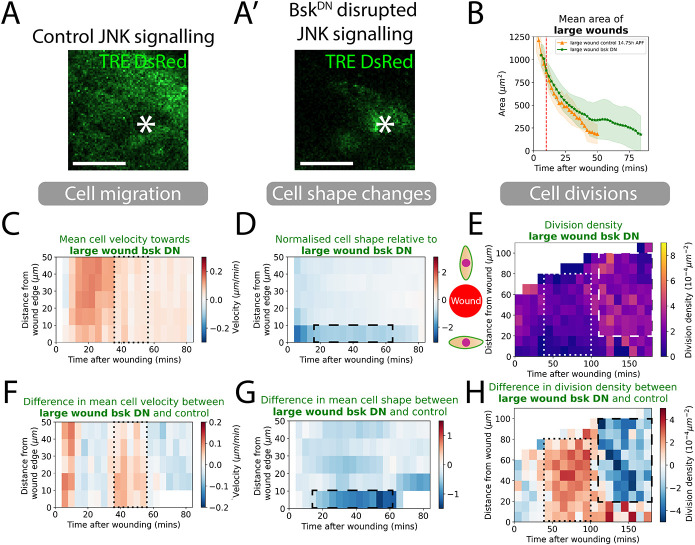
Fig. 4.
Knockdown of JNK signalling and quantification of how this alters cell behaviours in wound healing. (A,A′) JNK signalling reporter TRE-DsRed in control versus BskDN wing tissues at 5 h post-wounding to show dampened JNK signalling around the BskDN wound. White asterisks indicate the location of the wound. (B) Quantification of the wound area over time for control versus JNK knockdown tissues. Red dashed line is the 9-10 min point where we classify the size of wounds. (C) Spatio-temporal heatmaps of cell velocity relative to wounds for large wounds. Blue regions indicate cells that are migrating away from the wound and red indicates cells migrating towards the wound. (D) Spatio-temporal heatmaps of cell shape elongation relative to wounds for large wounds. Blue regions indicate cells that are elongated perpendicular to wounds and red indicates cells oriented towards the wound. (E) Heatmaps of the division density for wounds. (F) Spatio-temporal heatmaps of the change in cell velocity for control versus JNK knockdown wounds. Blue regions indicate slower cell migration towards the wound than controls and red regions indicate faster cell migration. (G) Spatio-temporal heatmaps of the change in cell shape elongation for control versus JNK knockdown wounds. Blue regions indicate that cells are more elongated along the wound margin than controls and red regions indicate that cells are more oriented towards the wound. (H) Heatmaps of the change in cell division density for control versus JNK knockdown wounds. Blue regions indicate lower cell density than controls and red regions indicate higher cell density. All heatmaps are weighted means of a cell behaviour for each wound video with the weight corresponding to the visible area of tissue in videos. n=5 control, 14.75 h APF wounds; n=6 BskDN wounds. Scale bars: 50 μm.

