. 2024 Oct 3;13:RP93666. doi: 10.7554/eLife.93666

Figure 4. Summary of the results from gene prioritization strategies used for genetic associations in AMR populations.

Genome-wide association studies (GWAS) catalog association for BAZ2B-AS was with FEV/FCV ratio. Literature-based evidence is further explored in ‘Discussion’.

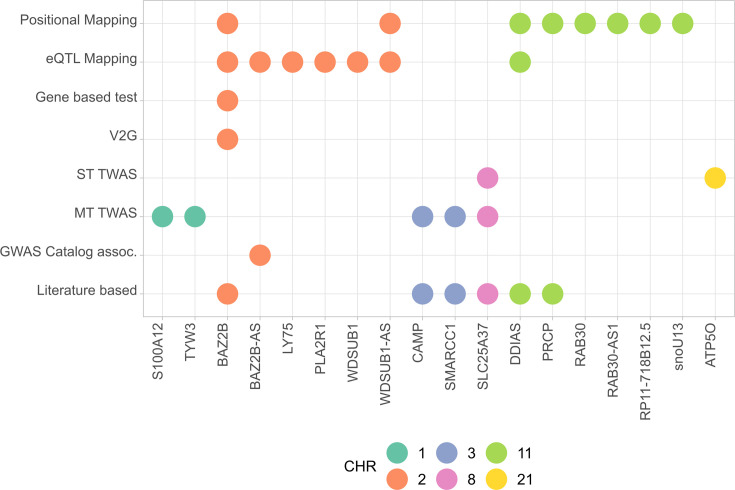
Figure 4.

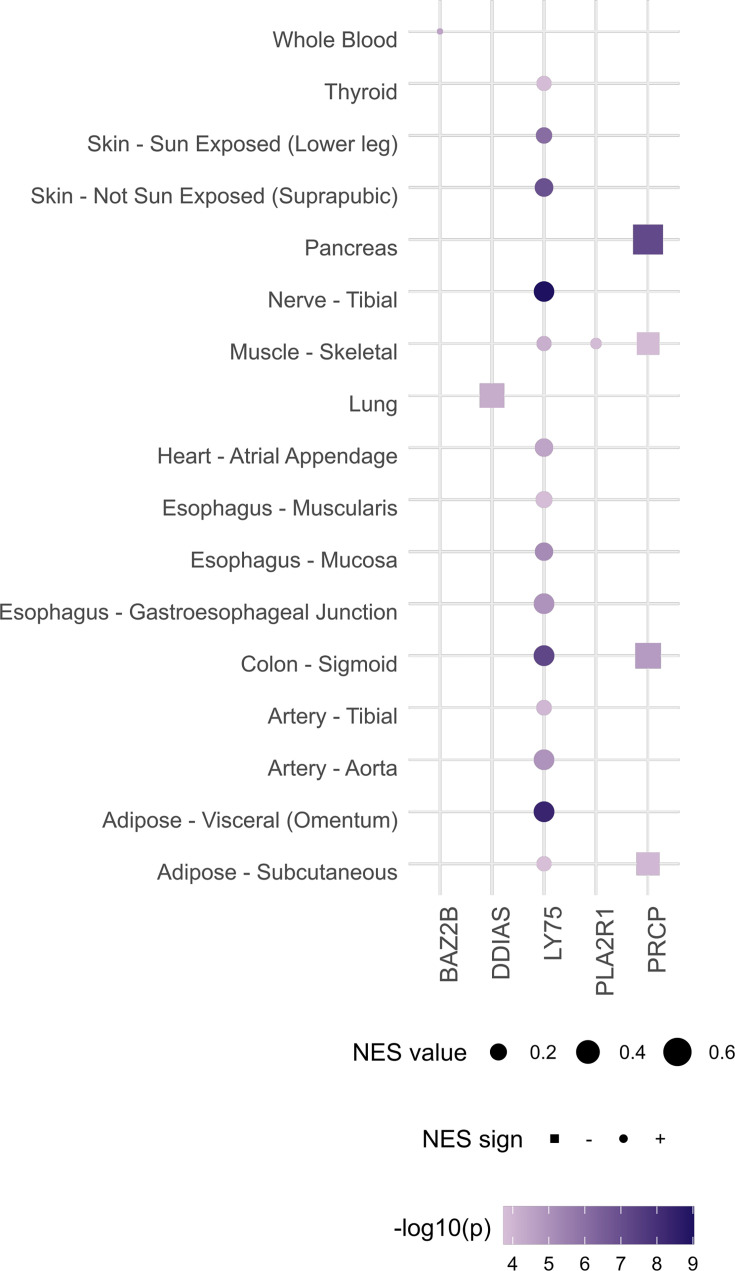
Figure 4—figure supplement 1. Gene‒tissue pairs for which either rs1003835 or rs60606421 are significant expression quantitative trait loci (eQTL) at false discovery rate (FDR) < 0.05 (data retrieved from https://gtexportal.org/home/snp/).

Figure 4—figure supplement 1.

rs1003835 (chromosome 2) maps to BAZ2B, LY75, and PLA2R1 genes. As for the lead variant of chromosome 11, rs77599934, since it was not an eQTL, we used an LD proxy variant (rs60606421). DDIAS and PRCP genes map closely to this variant. NES and p-values correspond to the normalized effect size (and direction) of eQTL-gene associations and the p-value for the tissue, respectively.