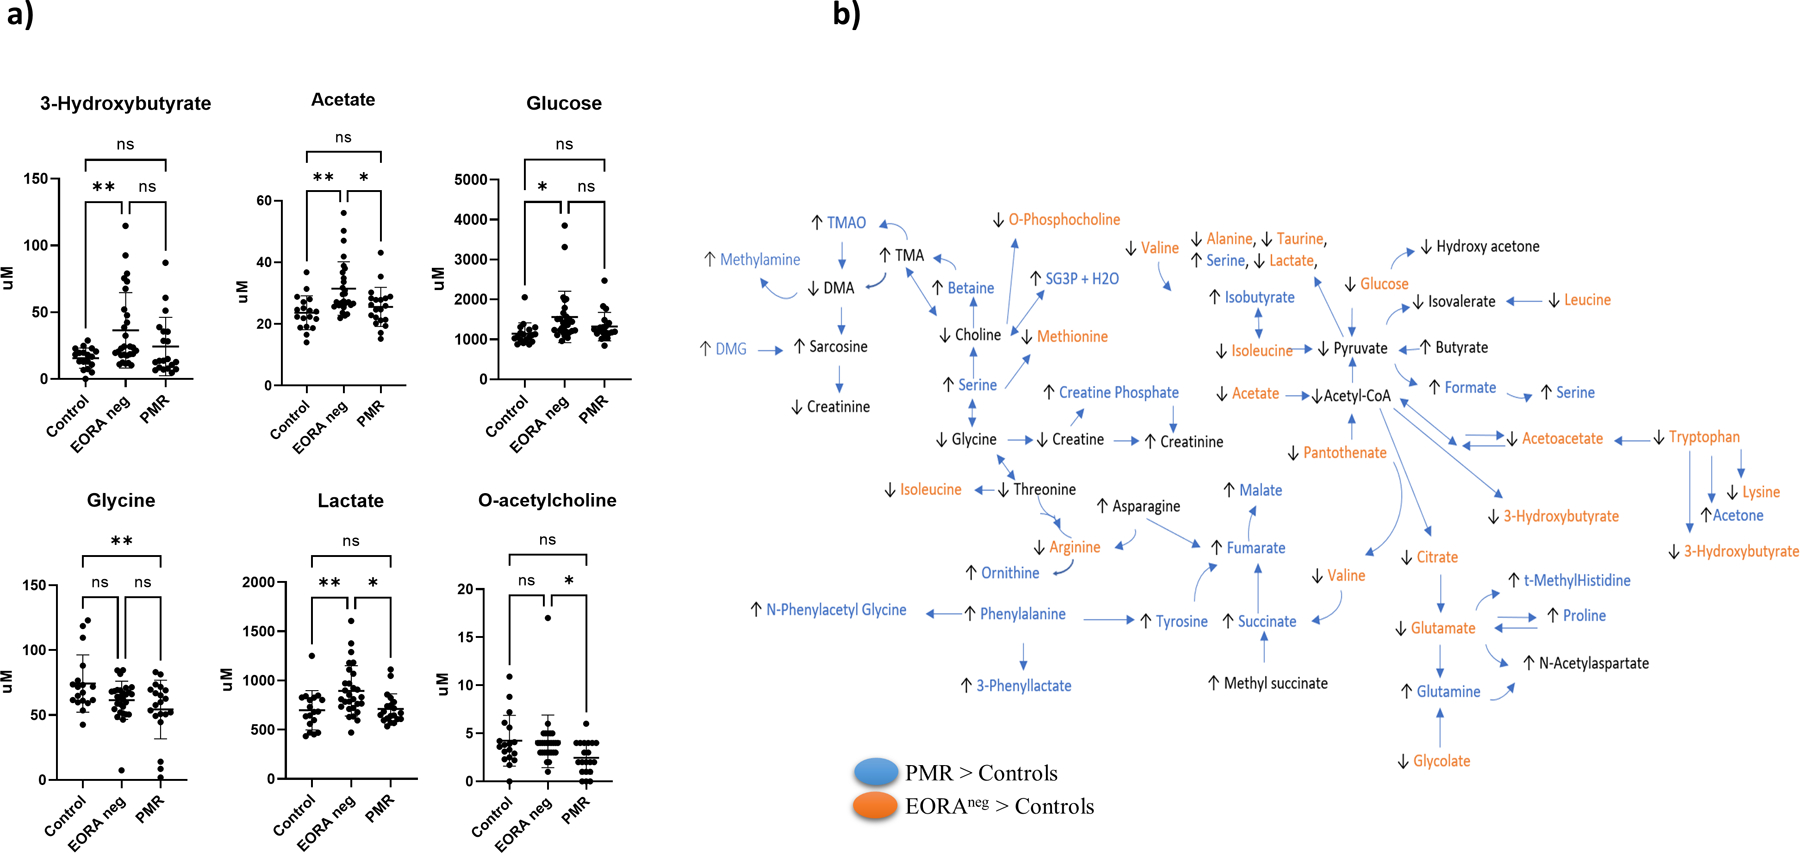
Fig. 2. Metabolite concentrations in control, PMR, and EORAneg samples.

a) Comparison of concentrations of significant metabolites identified by 1H-NMR between control, EORAneg, PMR at baseline adjusted by DM and sex using Tukey HSD as post-hoc analysis. The overall ANOVA p-value is below the metabolite name, while the p-values for the post-hoc analysis are located between groups. b) Map of metabolic pathways showing metabolites with a p<0.10 obtained from Tukey HSD analysis. Metabolites different in PMR compared to controls are highlighted in blue. Metabolites different in EORAneg compared to controls are highlighted in orange. Arrows indicate whether the metabolite concentration was higher or lower than in the control group. SG3PC: Sn-Glycero-3-Phosphocholine
