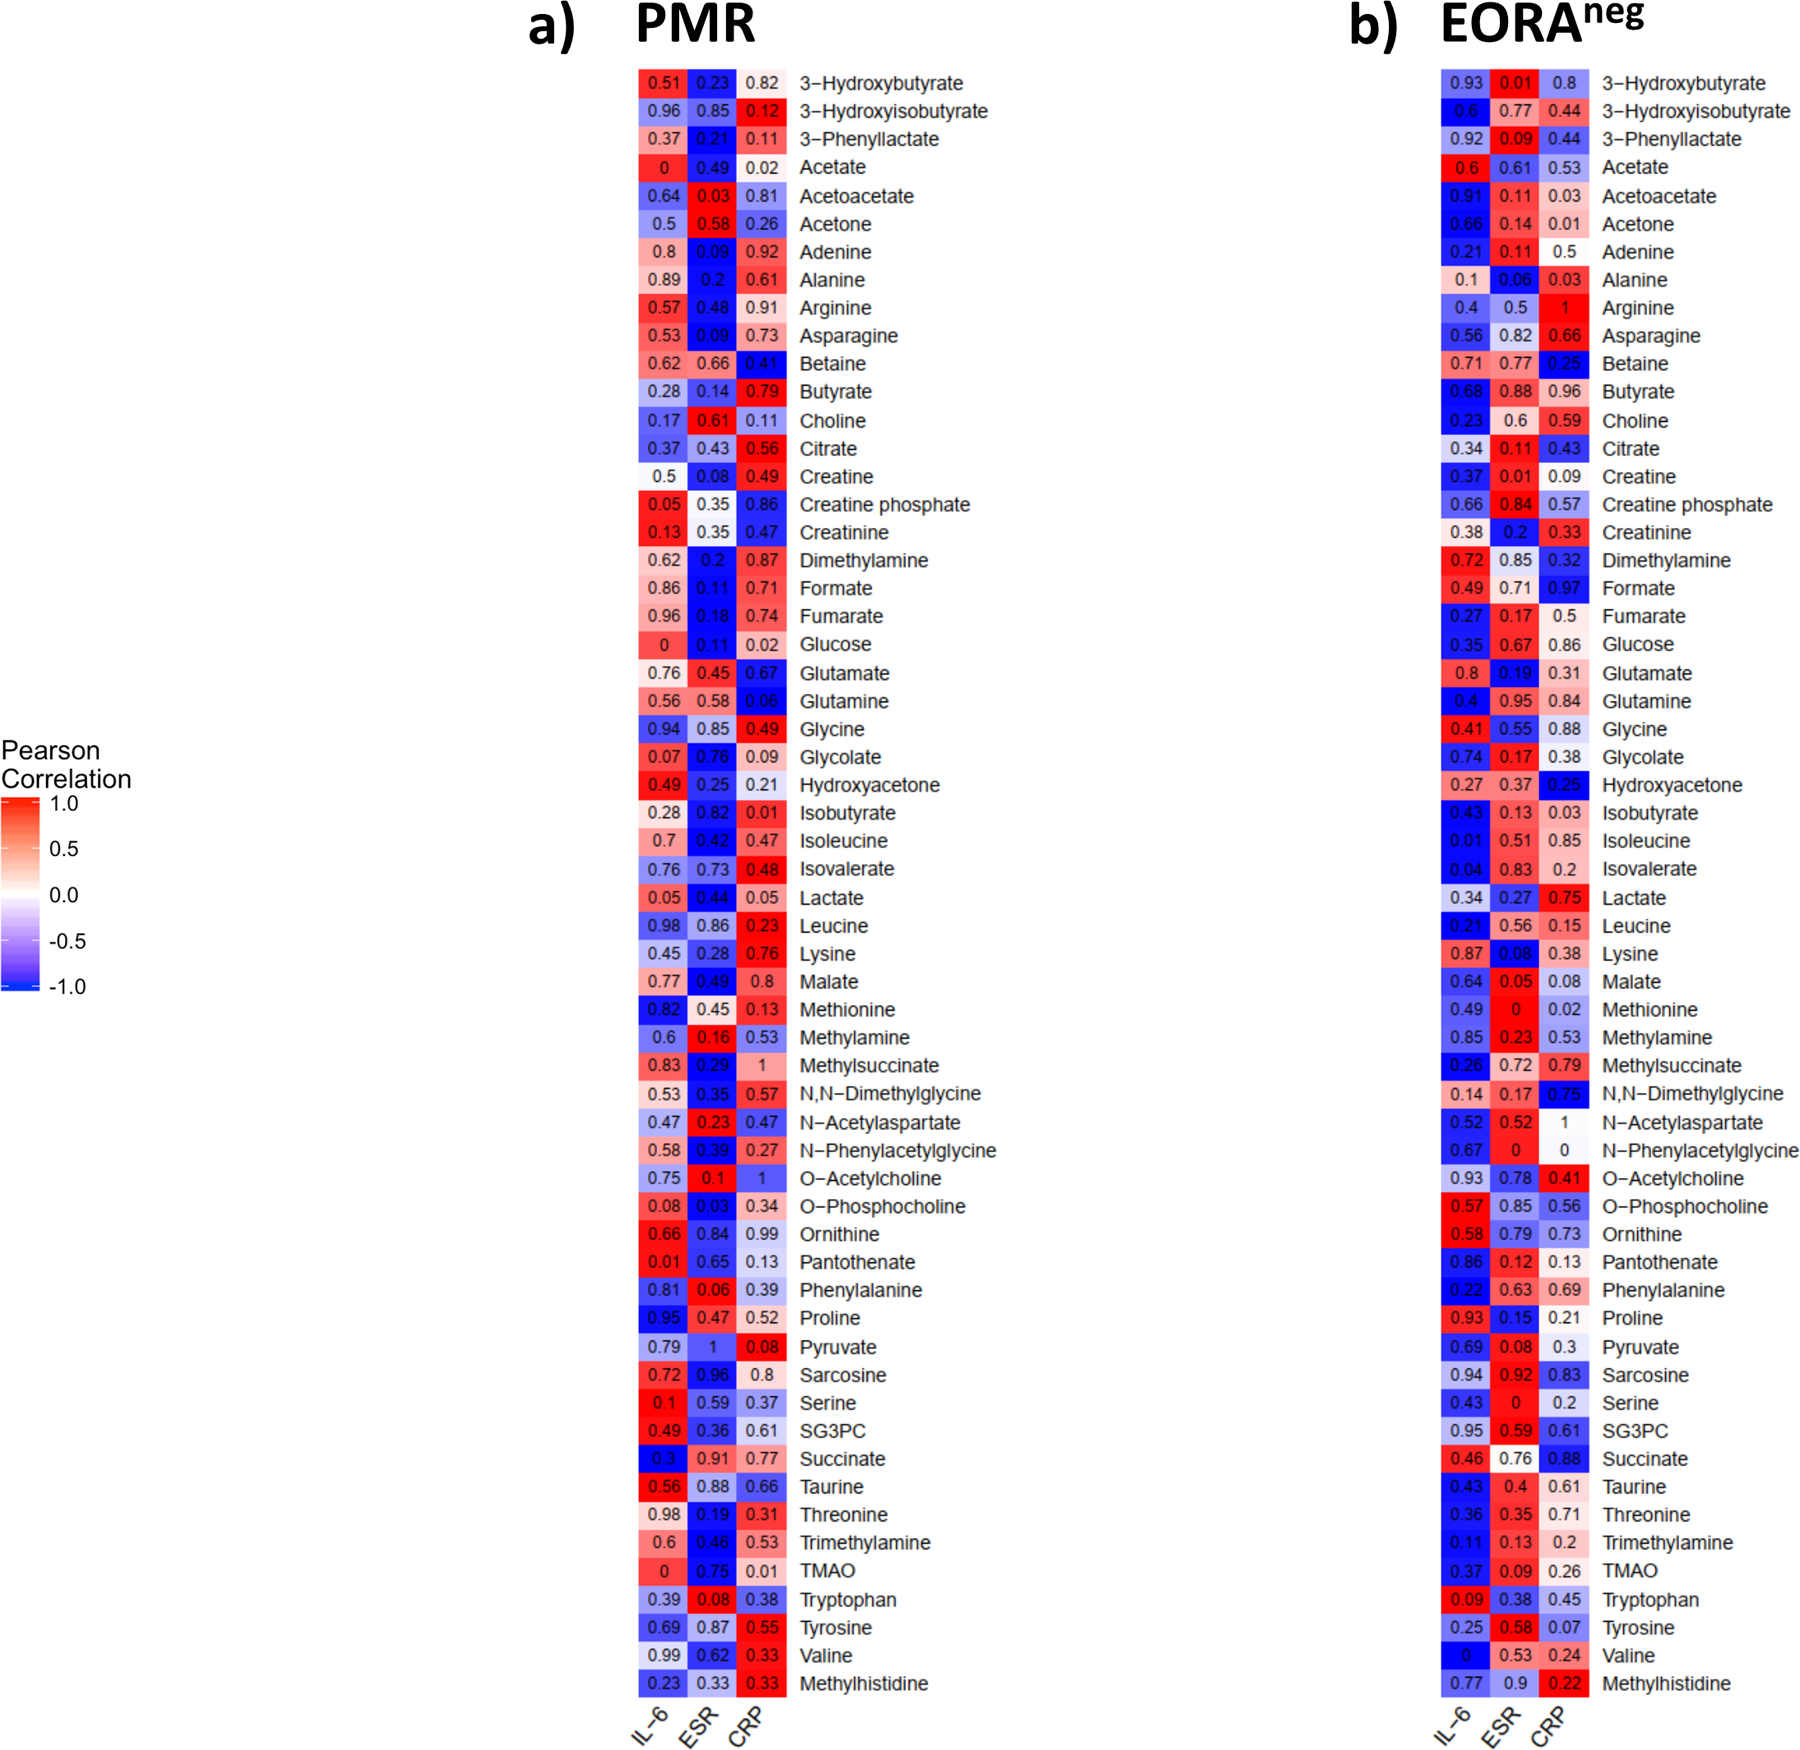
Fig. 3. Correlation between inflammatory markers and metabolites adjusted by age, sex, DM, and BMI at baseline.

a) The strength of association of each pair of PMR were used to form a cluster heatmap to lend inside which cytokine were correlated with which group of metabolites in serum using Pearson correlation; b) The strength of association of each pair of EORAneg were used to form a cluster heatmap to lend inside which cytokine were correlated with which group of metabolites in serum using Pearson correlation. Red color indicate positive correlation while blue negative correlation. The number on each cell refers the p-value of each pair of each group.
