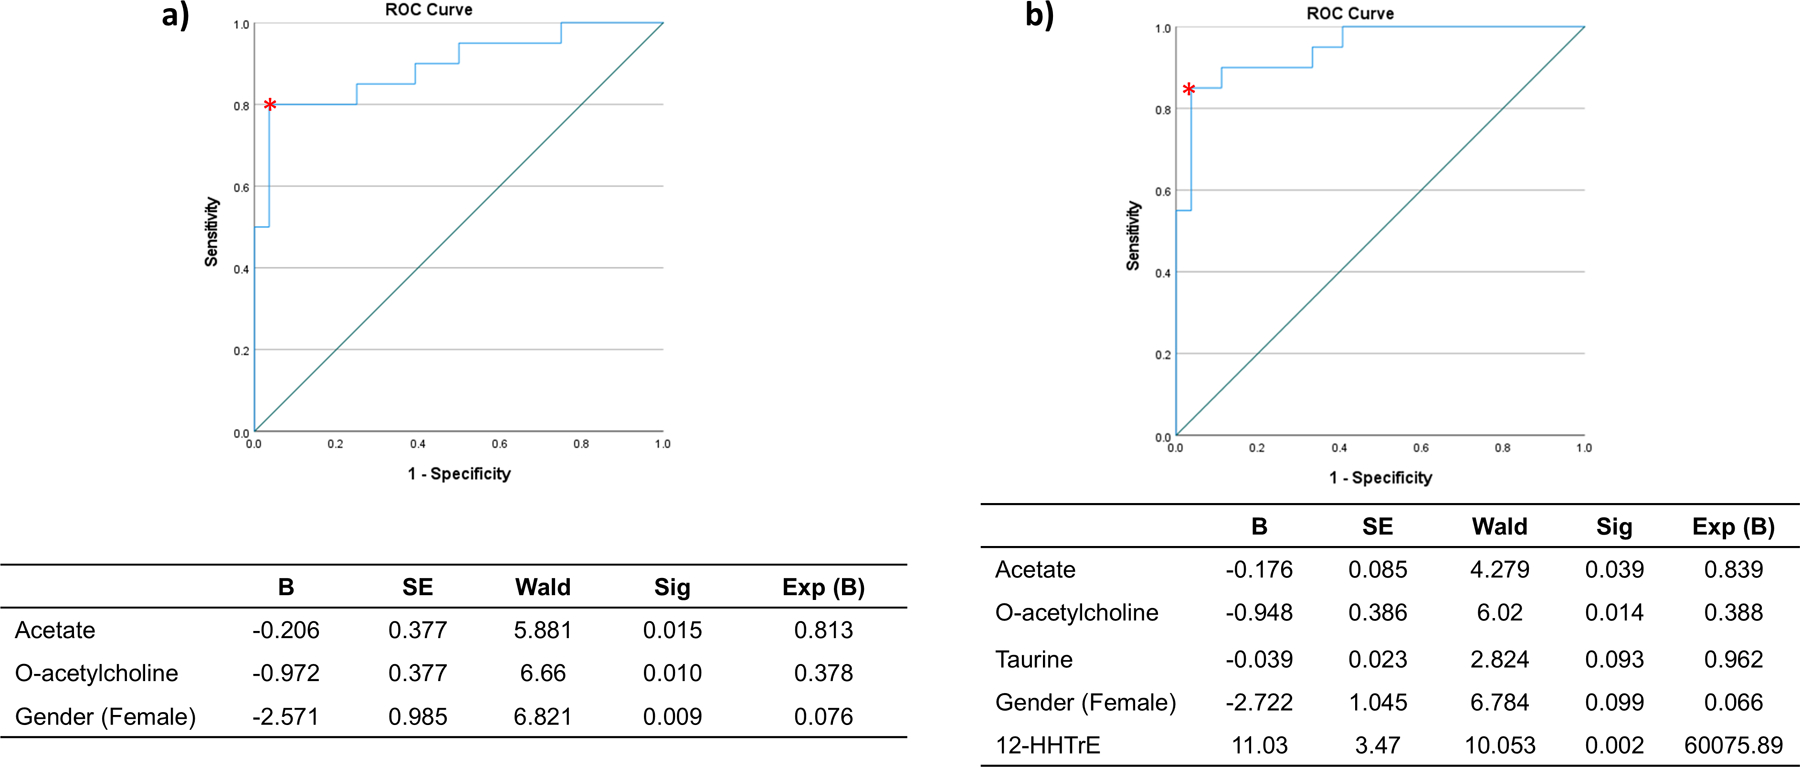
Fig. 4. Metabolomic prediction model for PMR classification.

PMR was considered the principal outcome. The logistic model used metabolites that had a p value <0.10 in the binary comparison between EORAneg and PMR. a) The model showed an area under curve of 0.925 with a sensibility= 90% and specificity= 92.3%; p<0.001. b) The model showed an area under curve of 0.944 with a sensibility= 95% and specificity= 88%; p<0.001, when the oxylipins were included in the model
