Fig. 2.

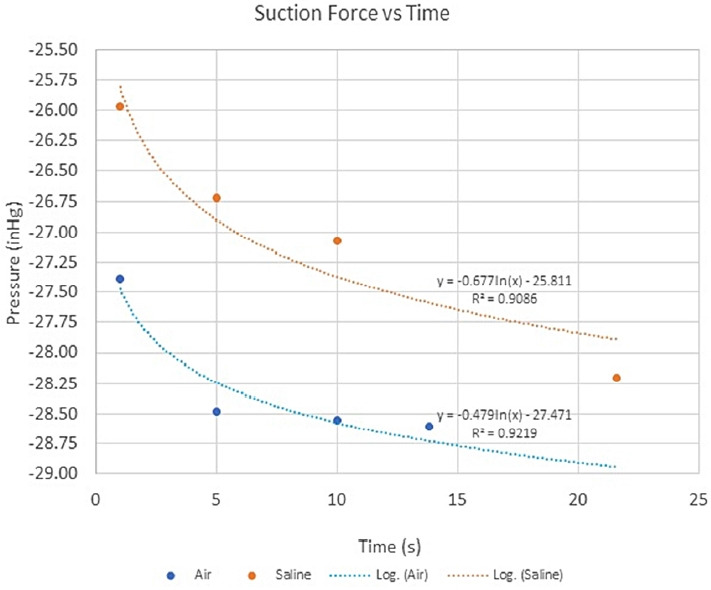
Suction force data at key time points (1, 5, 10 seconds and Tmax) and corresponding best fit curves with equation and Pearson Correlation Coefficients.

Suction force data at key time points (1, 5, 10 seconds and Tmax) and corresponding best fit curves with equation and Pearson Correlation Coefficients.