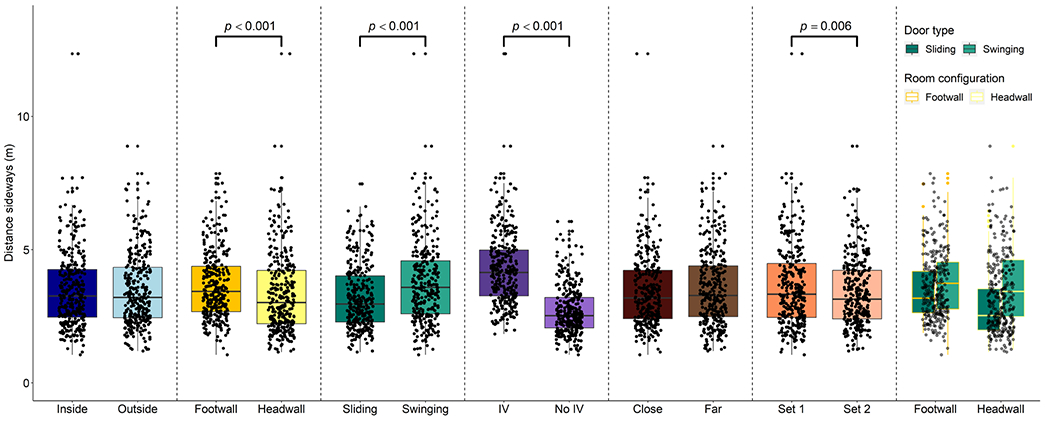
Figure 11.

These box and jitter plots serve as visual representations of distance sideways distributions across multiple factor combinations. Each factor, such as door type, is allocated a unique color for clear differentiation, with shading employed to denote specific factor levels, such as sliding and swinging doors. The room configuration, door type, IV pole presence and set number exhibited increased sideways motions, as highlighted by the p-values and brackets. The interaction between room configuration and door type affected sideways traveling, with each dot representing an individual trial.
