
Figure 9.
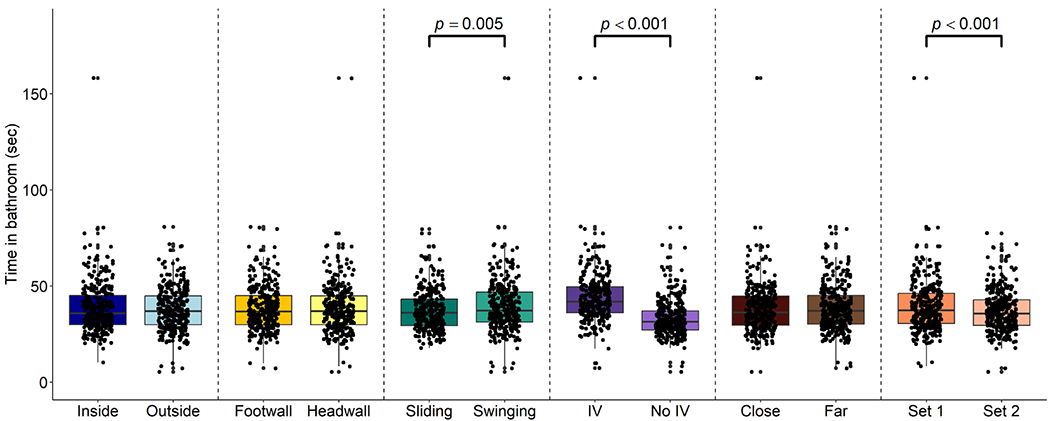
Total time in the bathroom for each combination of factors are presented in box and jitter plots. Each factor, like door type, is represented by a different color, while within-factor variations, such as sliding and swinging door options, are highlighted with varying shading. The door type, IV pole presence, and set number all had a significant impact on the time spent in the bathroom, as indicated by the p-values and brackets. Each dot represents a single trial.