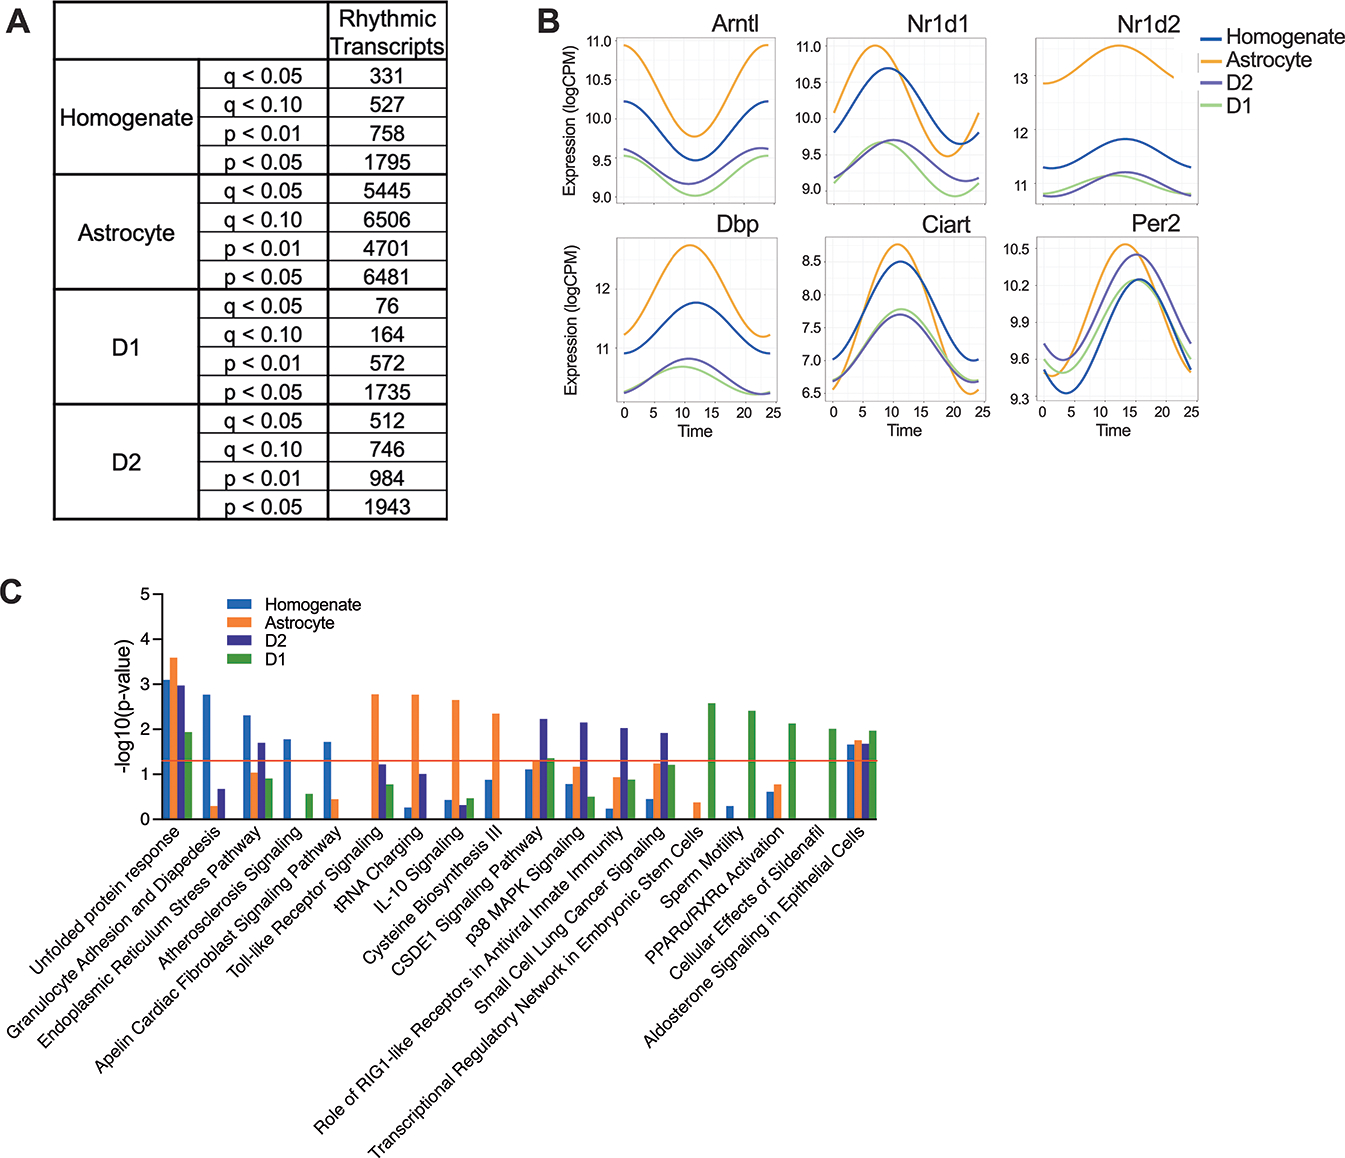
Figure 1. Rhythmicity in the NAc varies by cell type.

(A) Table listing numbers of rhythmic transcripts identified in each cell type in the NAc at various thresholds of significance (p values and q values (Benjamini-Hochberg correction). (B) Scatterplots show expression patterns (logCPM) across time of day for top rhythmic transcripts. These six core clock genes have consistent peak times across cell type. (C) For each cell type, pathway analyses identified pathways of rhythmic transcripts, which reached a significance threshold of p<0.05. The top 5 enriched pathways from each cell type are plotted together.
