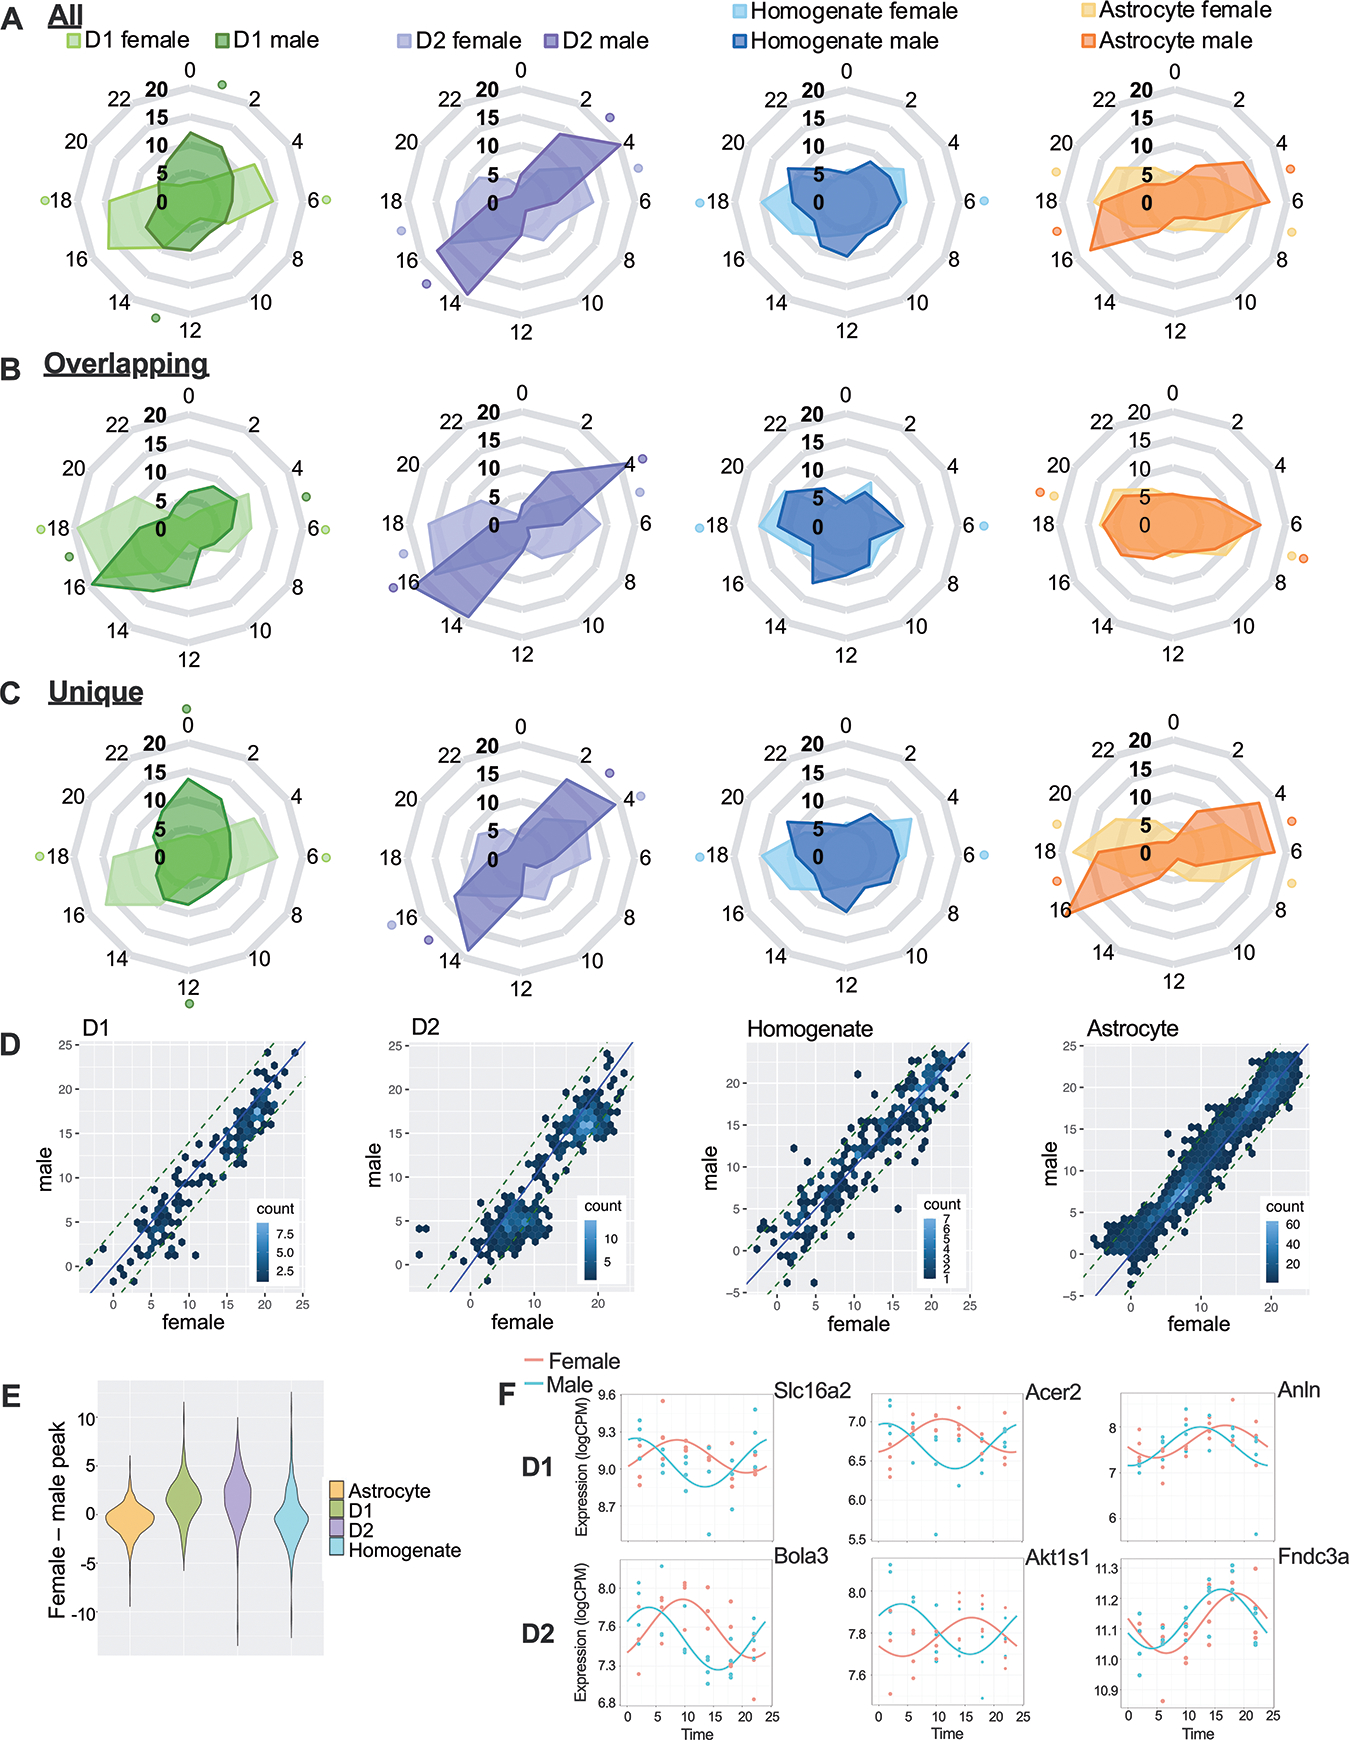
Figure 3. Rhythmic transcripts tend to peak later in females than males.

(A) Peak times for each rhythmic transcript are shown in radar plots for each cell type in males and females across the 24-hour clock (ZT). The time with the highest proportion of peaking genes, as well as its opposite (12-hours apart), is indicated with a dot. Separate radar plots are shown for rhythmic transcripts that are (B) overlapping or (C) unique in males and females. (D) For genes that overlap in males and females, we also show phase concordance plots and (E) quantified the difference in peak time. On average, transcripts peaked 2 hours later in D1 and D2 cells taken from females compared to males. (F) Example transcripts with varying peak times across sex are shown with smoothed curves as well as individual data points: (left) ~6 hour, (middle) ~12 hour and (right) ~2-hour difference.
