
Figure 4. Rhythmic transcripts peaking in the light phase contribute to largely distinct enriched pathways.
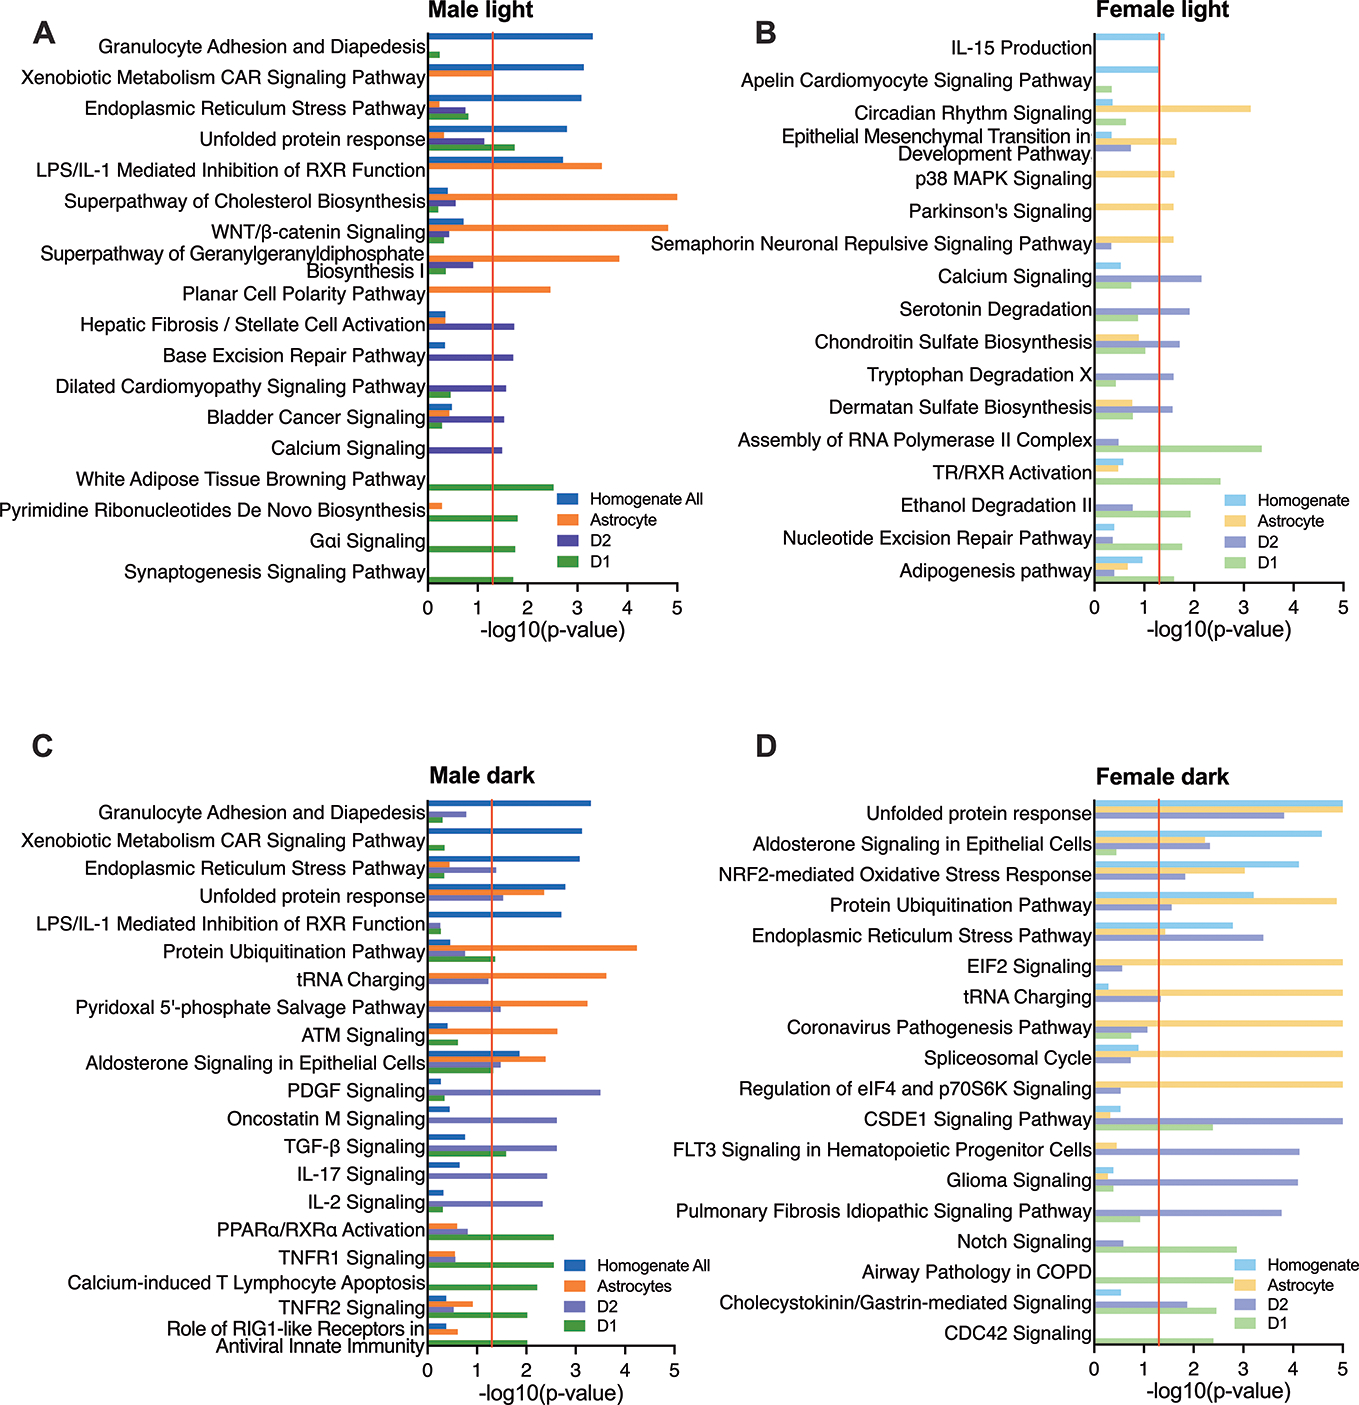
(A-D) Pathway analyses identified significant pathways (p<0.05) enriched for rhythmic transcripts falling into clustered peaks (“light” and “dark”). The tope 5 enriched pathways from each cell type are plotted together for each sex and peak time. For proper scale, p-values are truncated at -log10(p-value)≤5 even if the pathway is more significantly enriched.