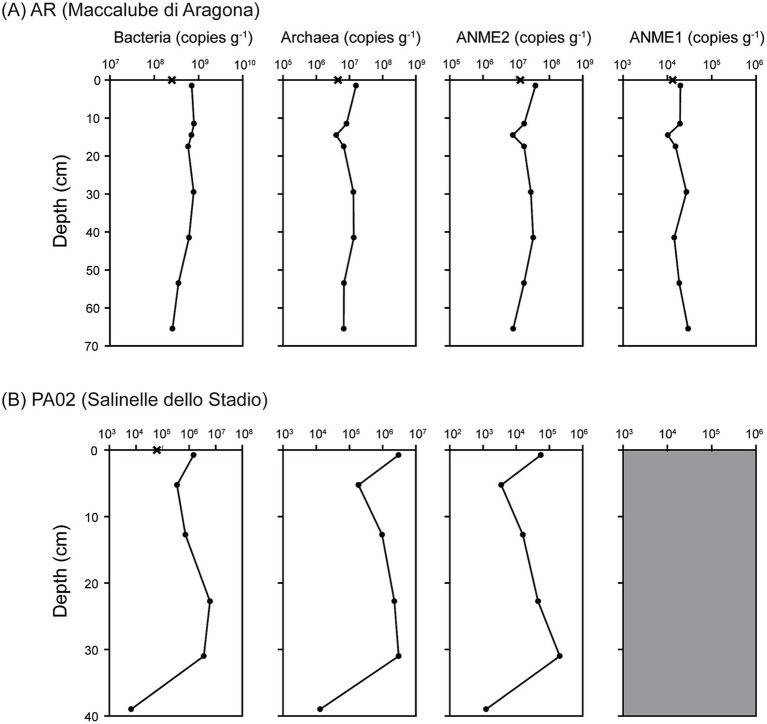
Figure 4.
Copy numbers of 16S rRNA gene for different taxonomic groups. (A) Results for site Agragona (AR). (B) Results for site Vallone (PA02). All the reported values represent the averages of triplicate analyses. The standard deviations were less than 20% of the average values and too small to be shown. The gray area for the ANME1 group from site PA02 represents the gene abundances were below the detection level.

