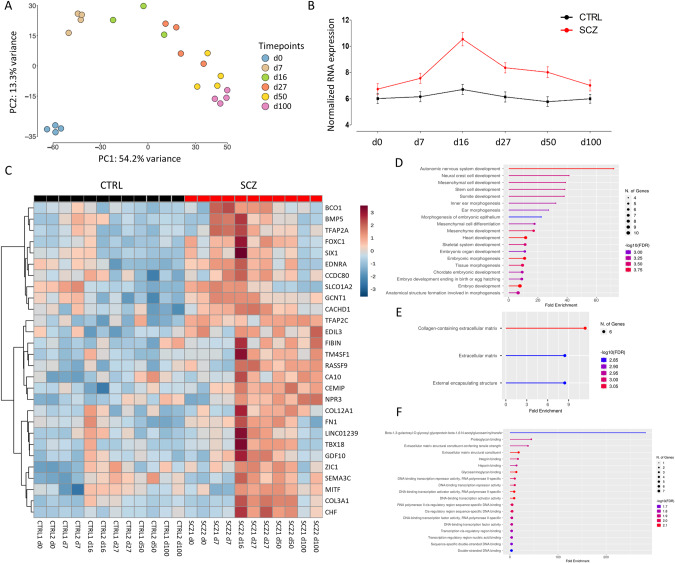
Fig. 2. Gene expression analysis of SCZ and CTRL lines during in vitro cortical differentiation.
A Plot of principal components PC1 and PC2, obtained from the PCA of transcriptomic data from all SCZ and CTRL lines of six time points during cortical differentiation. Each dot represents a cell line, colored by the respective time point. B Trajectory analysis of all differentially expressed genes (DEGs) from d0 to 100. Black line, CTRL group; red line, SCZ group. Data are represented as arithmetic mean ± SEM. C Heatmap visualization showing the most significant SCZ DEGs. Rows: DEGs; columns: CTRL (CTRL 1 and CTRL 2) and schizophrenia (SCZ 1 and SCZ 2) samples in d0, 7, 16, 27, 50, and 100. GO analysis highlighting the biological processes (D), molecular functions (E) and cellular components (F) of the DEGs. GO terms were generated with the ShinyGO 0.80 graphical gene-set enrichment tool [36]. d day in vitro, CTRL control, SCZ schizophrenia.

