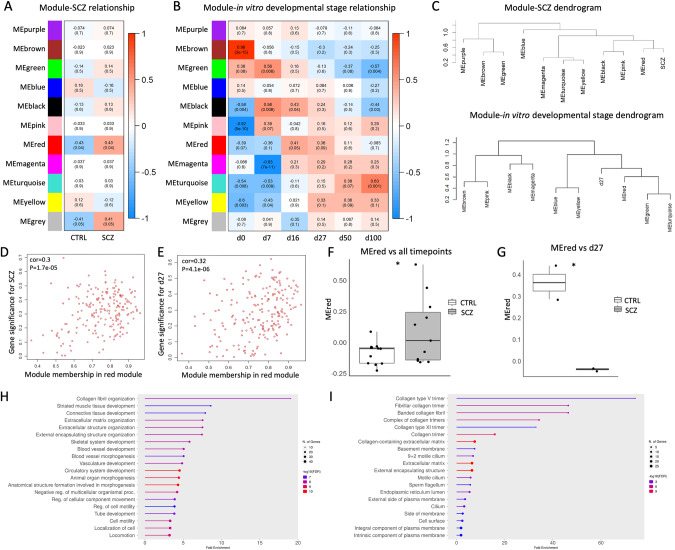
Fig. 3. Results of weighted gene correlation network analysis (WGCNA) and module-trait relationships.
Module eigengene (ME) comparison of each module with the disease trait (A) and the six subsequent time points (B), based on Pearson’s correlation. Columns correspond to the different traits; rows correspond to the ME of each module. Upper value in each cell corresponds to Pearson’s correlation; bottom value, p-value; right panel, color scale according to correlation. C Hierarchical clustering of ME and the SCZ trait reveals higher correlation of the red cluster with SCZ and d27. Scatter plots depicting the gene significance-module membership (MM) correlation for the SCZ trait (D) and for d27 (E). Box and whiskers plots showing the relationship between the red module and the disease trait (p-value = 0.0402; F) and the timepoint d27 (p-value = 0.0353; G). GO analysis highlighting the biological processes (H) and cellular components (I) of the red module genes. GO terms were generated with the ShinyGO 0.80 graphical gene-set enrichment tool [36]. d day in vitro, CTRL control, SCZ schizophrenia, ME module eigengene. *p < 0.05.

