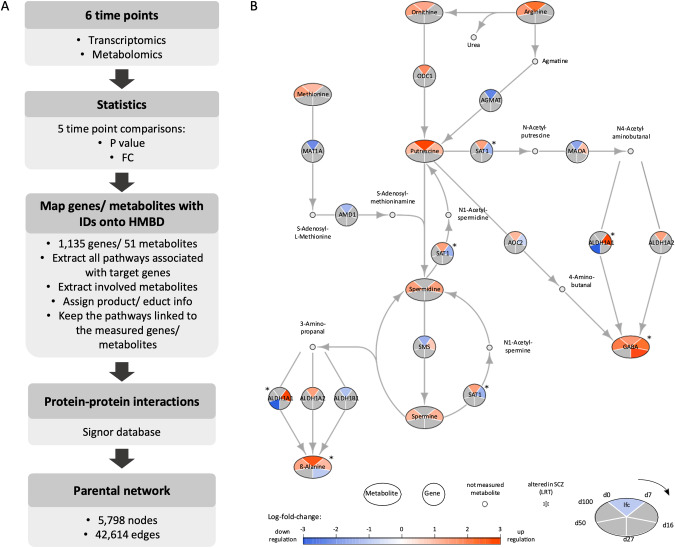
Fig. 5. Transcriptomic-metabolomic integrative network reconstruction across neuronal differentiation reveals an interesting subnetwork of polyamine metabolism.
A Schematic flowchart of the transcriptomic-metabolomic integrative network construction. Transcriptomic and metabolomic data were obtained from the six consecutive time points (see Fig. 1). Five comparisons between every two subsequent time points were performed and the statistical p-values and fold change (FC) were calculated. The pathways associated with the measured genes were extracted. The associated metabolites were identified and the product/educt information for each reaction was added. Only the pathways related to the measured genes and metabolites were kept for the network reconstruction. Finally, the parental network was enriched with protein-protein information, extracted from the Signor database and the subnetworks of interest were extracted for further analysis. B Polyamine metabolism subnetwork. The global changes in metabolite abundance and gene expression levels, across five consecutive time point comparisons are shown for the subnetwork of the polyamine metabolism. Network nodes depict differentially expressed genes (circles) and metabolites (ellipses), as well as not measured metabolites (small gray dots). Network edges depict individual reactions and the associated genes. Log2FC are converted to a color gradient scale, ranging from blue (indicating downregulation to the previous time point) to red (indicating upregulation). The genes and metabolites with no significant change within a certain comparison are depicted in gray. Starting in the upper pie section, the comparison between iPSCs and d7 is depicted, continuing in a clockwise direction for all subsequent comparisons. The genes and metabolites marked with an asterisk are altered in the SCZ condition. FC fold change, lfc log fold change, LRT likelihood ratio test, d day in vitro.

