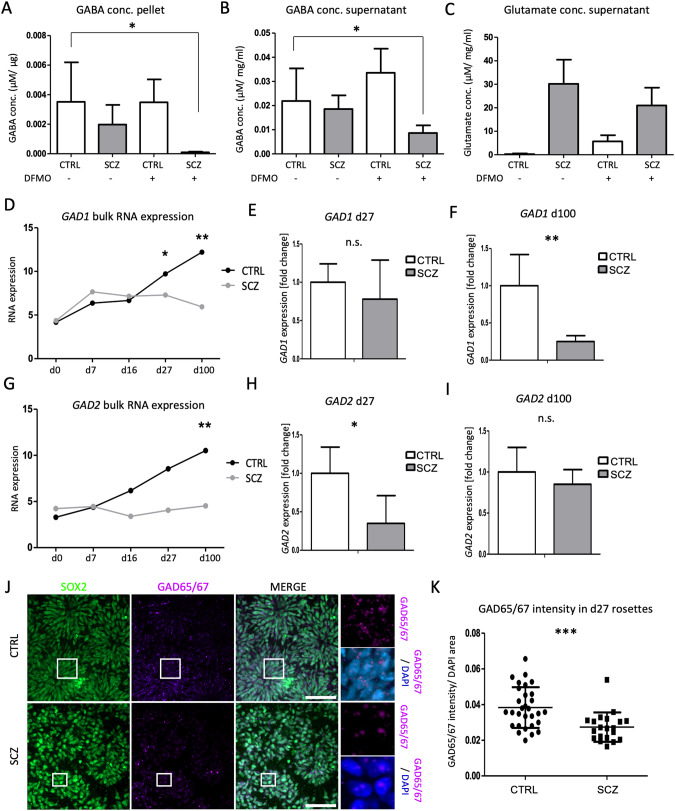
Fig. 6. Altered GABA biosynthetic pathways in SCZ samples.
Targeted mass spectrometry analysis of GABA levels in cellular pellets (A) and supernatants (B), as well as glutamate (C) from d27 samples, with and without DFMO treatment. Errors bars represent mean ± S.E.M. GAD1 RNA levels from the bulk RNA-seq data (D) and qRT-PCR analyses at d27 (E) and d100 (F). GAD2 RNA levels from the bulk RNA-seq data (G) and qRT-PCR analyses at d27 (H) and d100 (I). Errors bars represent mean ± S.D. J Representative ICC staining of SCZ and CTRL lines at d27 for the stem cell marker SOX2 (green) and glutamate decarboxylase 65/67 (GAD65/67, magenta). Scalebars, 50 μm. K Intensity quantification of GAD65/67. The intensity measurements were normalized against the DAPI+/nuclear area. conc. concentration, n.s. not significant, d day in vitro, CTRL control, SCZ schizophrenia, S.E.M standard error, S.D. standard deviation. *p < 0.05, **p < 0.005, ***p < 0.0001.

