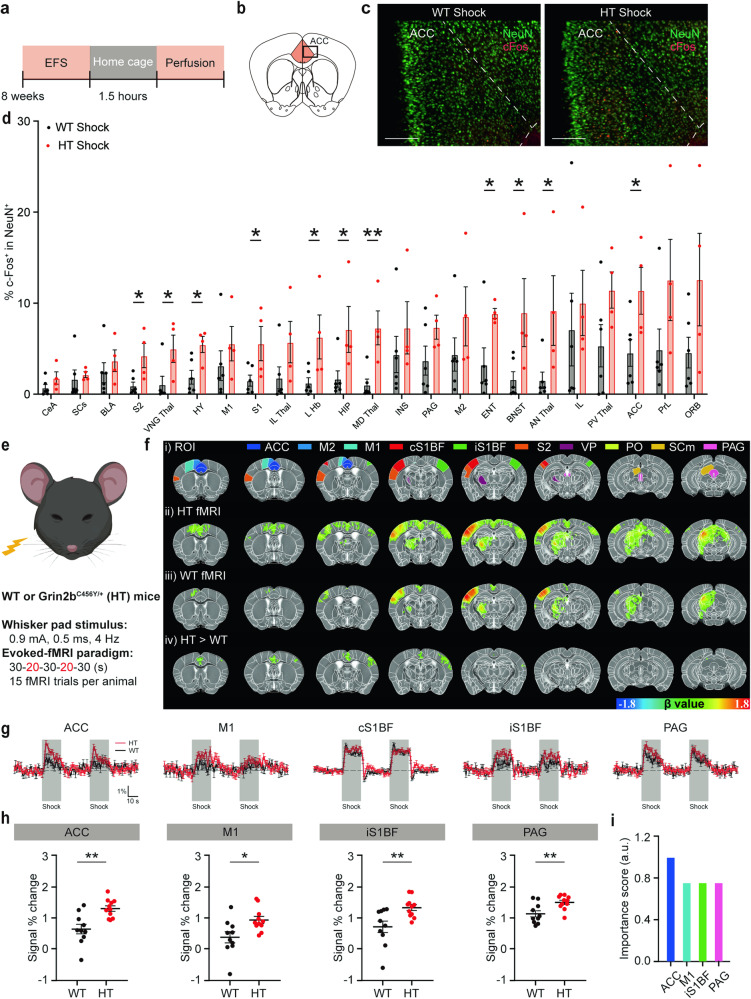
Fig. 2. Grin2bC456Y/+ brain regions display stronger increases in foot shock-induced c-fos signals and whisker stimulation-induced fMRI signals.
a A schematic diagram showing electric foot shocks followed by home-cage rest (1.5 h) and brain perfusion for c-fos staining. b, c Anterior cingulate cortex/ACC as an example of a brain region showing stronger foot shock-induced increases in c-fos signals for Grin2bC456Y/+ mice relative to WT mice. NeuN staining was performed to identify c-fos signals in neurons. Scale bar, 200 µm. d Quantification of the results shown in Supplementary Fig. 2 indicating stronger foot shock-induced increases in c-fos signals in Grin2bC456Y/+ brain regions, as compared with those in WT mice. ACC anterior cingulate cortex, AN Thal anterior group of the dorsal thalamus, BLA basolateral amygdala, BNST bed nuclei of the stria terminalis, CeA central amygdala, ENT entorhinal cortex, HIP hippocampus, HY hypothalamus, IL infralimbic cortex, IL Thal intralaminar nuclei of the dorsal thalamus, INS insular cortex, L Hb lateral habenula, MD Thal medial group of the dorsal thalamus, M1 primary motor cortex, M2 secondary motor cortex, ORB orbital cortex, PAG periaqueductal gray, PrL prelimbic cortex, PV Thal paraventricular nucleus of the thalamus, SCs superior colliculus, S1 primary somatosensory cortex; S2, secondary somatosensory cortex; VNG Thal, ventral group of the dorsal thalamus (n = 6 mice [WT], 4 [HT], Student’s t-test). e A schematic diagram showing whisker-pad stimulation during fMRI imaging experiments. An anesthetized mouse (maintained by continuous intravenous infusion of dexmedetomidine with 0.3% isoflurane) was stimulated by a whisker pad shock (0.9 mA; 0.5 ms; 4 Hz; two 20-s stimulations interleaved with three 30-s intervals) while acquiring fMRI images at an ultrahigh field of 15.2 T. f fMRI activation maps and regions of interest (ROIs). fMRI signals were elicited by whisker-stimulation in Grin2bC456Y/+ and WT mice (2–3 months). ROIs in the first row indicate those used for fMRI signal quantifications in rows ii, iii, and iv. The signals in the last row (HT [Grin2bC456Y/+] > WT) indicate the numerical difference between β values of significantly different HT (Grin2bC456Y/+) and WT voxels, shown in upper rows (Student’s t-test). ACC, anterior cingulate cortex; M1, primary motor cortex; M2, secondary motor cortex; PAG, periaqueductal gray; PO, posterior complex of the thalamus; SCm, superior colliculus, motor related; cS1BF, contralateral primary somatosensory cortex of barrel field; iS1BF, ipsilateral primary somatosensory cortex of barrel field; S2, secondary somatosensory cortex; VP, ventral posterior complex of the thalamus. g Traces of fMRI signals before/during (gray blocks)/after whisker stimulation in different brain regions of Grin2bC456Y/+ and WT mice (2–3 months); see also Supplementary Fig. 4 for other brain regions. h Quantification of the results in (g); only significantly different results are shown (n = 11 mice [HT], 10 [WT], Student’s t-test). i Comparison of the importance scores in select brains, including the ACC (see “Methods” for details). Significance is indicated as * (<0.05), ** (<0.01), *** (<0.001), or ns (not significant).

