FIGURE 4.
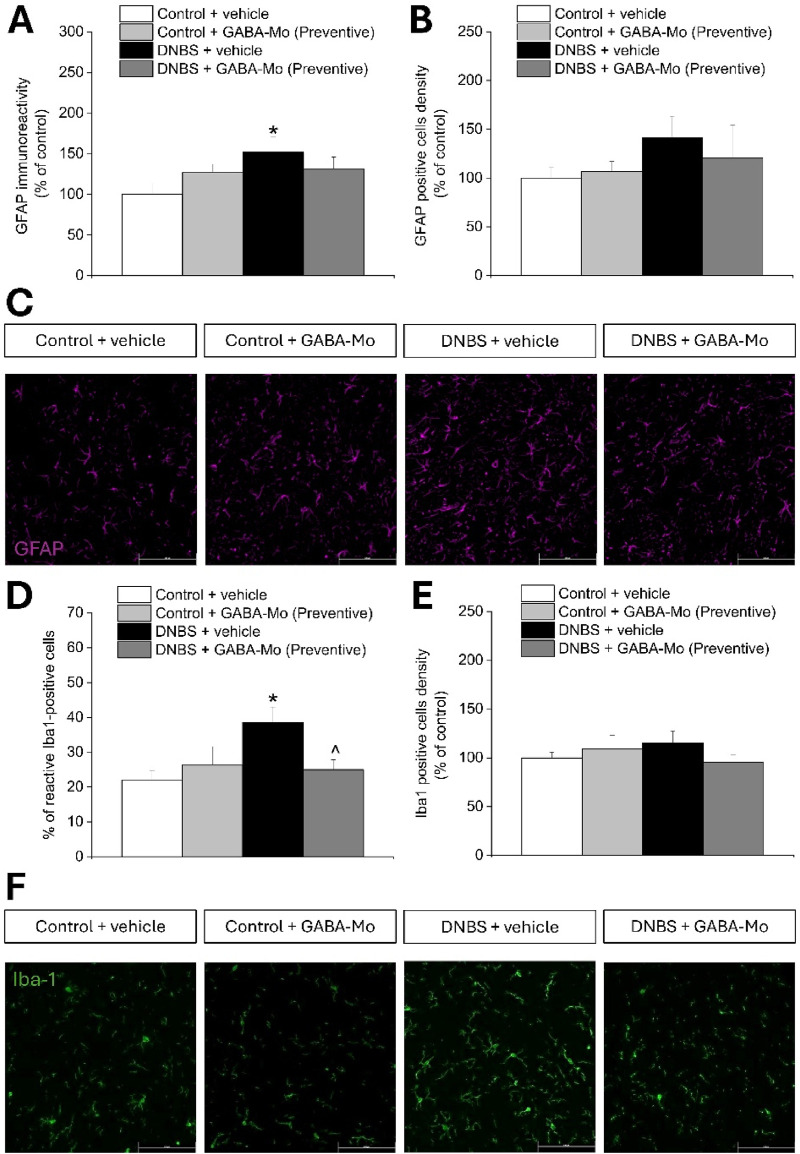
Effect of DNBS treatment and preventive protocol with GABA-Mo on astrocytes and microglia activation in the spinal cord. The graphs show the quantification of GFAP immunoreactivity (A) and the density of GFAP-positive cells (B), with representative images showing the expression of GFAP (purple); (C), 14 days after DNBS injection. The figure reports the quantification of the percentage of reactive Iba-1-positive cells (D) and the density of Iba-1-positive cells (E), with representative images showing the expression of Iba-1 (green); (F), 14 days after DNBS injection. The quantitative analysis of immunofluorescence was performed by collecting independent fields from the dorsal horns of the spinal cord. *P < 0.05 vs. Control + vehicle group. ∧ P < 0.05 vs. DNBS + vehicle group. Original magnification: ×20.

