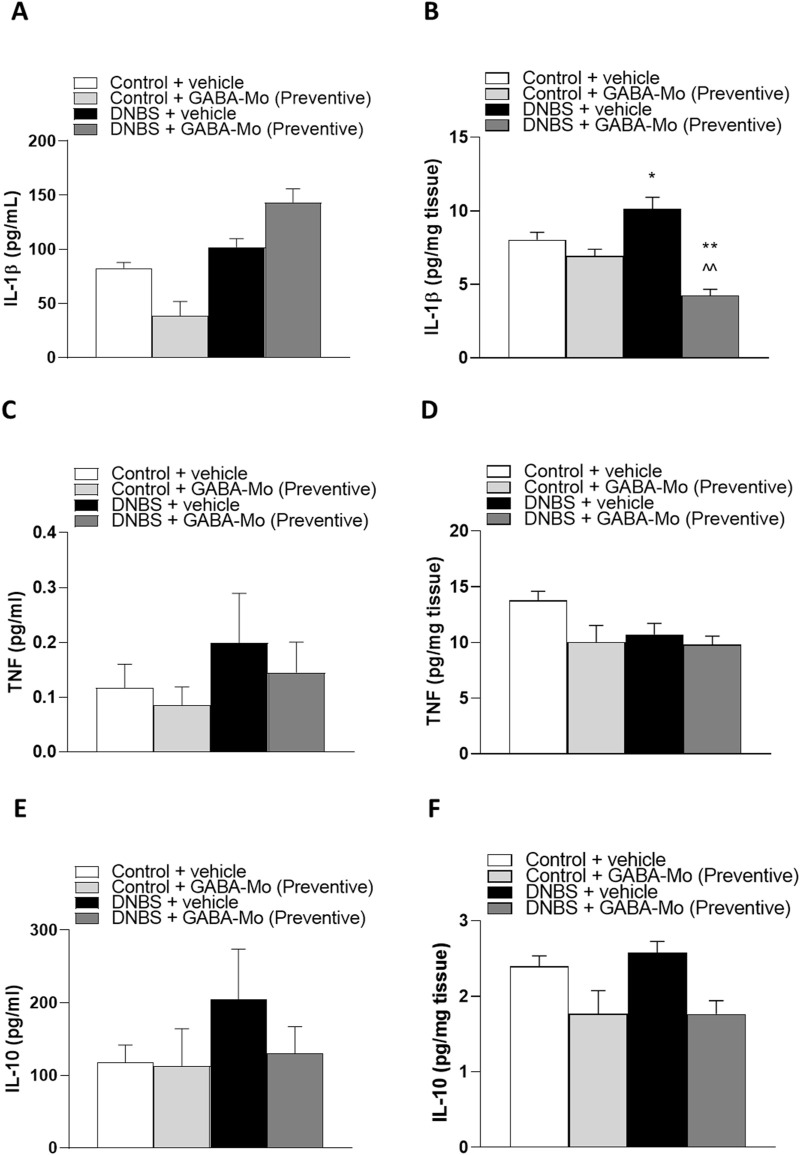
FIGURE 9.
Preventive protocol. IL-1β levels in plasma (A) and colonic tissues (B); TNF levels in plasma (C) and colonic tissues (D), IL-10 levels in plasma (E) and colonic tissues (F) in control or DNBS rats treated with vehicle or GABA-Mo. Each column represents the mean ± SEM from eight animals. **P < 0.01 vs. Control + vehicle group. ∧ ∧ P < 0.01 vs. DNBS + vehicle group.

