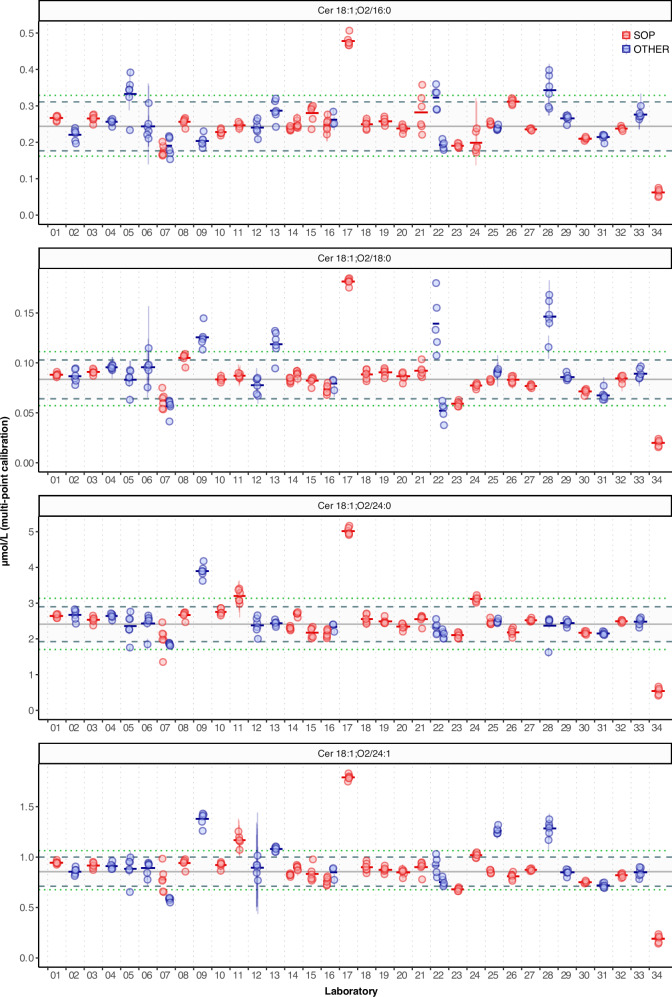
Fig. 1. Consensus concentrations of ceramides in NIST SRM 1950 across all study participants.
Concentrations of the 4 reported ceramides in NIST SRM 1950. Each circle corresponds to the mean of 1 to 6 replicate measurements from a vial of NIST SRM 1950 shipped to each of the participating laboratories. The error bars depict the ±1 × SD of 3 injection replicates, which in some cases is smaller than the diameter of the plotted circle or absent if only 1 measurement was made. Horizontal bars represent the mean values of the mean measured concentration per NIST vial. The outer green dotted lines indicate used for as cut-off values for outlier removal. The mean ±2 × SD (dashed grey lines) are based on data after outlier removal. Molar concentrations were calculated using the external calibration curve (multi-point calibration). SOP (red) and OTHER (blue) refer to the Standard vs Other methods, respectively. Source data are provided as Source Data File.

