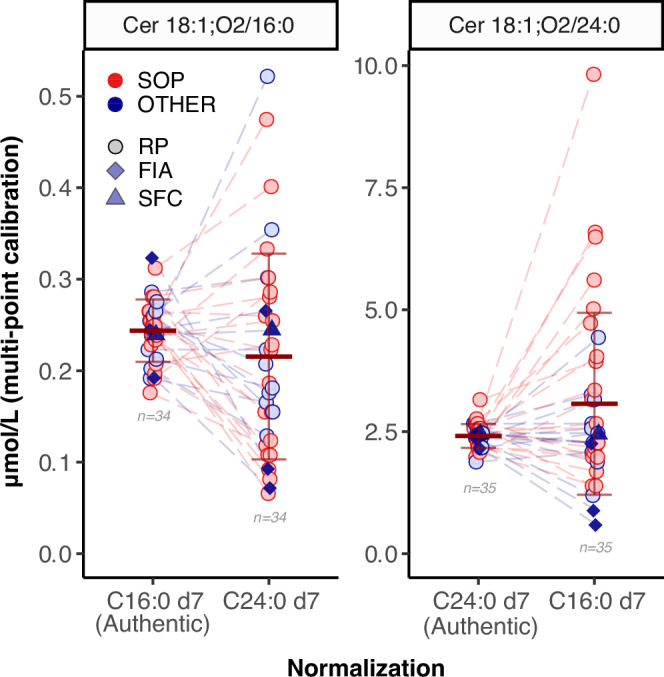
Fig. 5. Authentic vs non authentic internal standard normalization and its effects on quantification for SRM 1950 RM.

Authentic vs non authentic internal standard normalization and its effects on bias and variability. The horizontal bars correspond to the mean and ±1 × SD of all shown data per group (number of data points indicated for each group). Data originating from the same laboratory are connected by dashed lines. SOP (red) and OTHER (blue) refer to the Standard vs other methods, respectively. Outliers in the authentic internal standard groups have been removed in all groups for each ceramide species (see Fig. 1 and text). Additionally, dataset 11 was excluded for Cer16:0 as it had 15x higher concentrations than the second highest data point for C24:0 d7 normalization.
